 3
3peptides
spectra
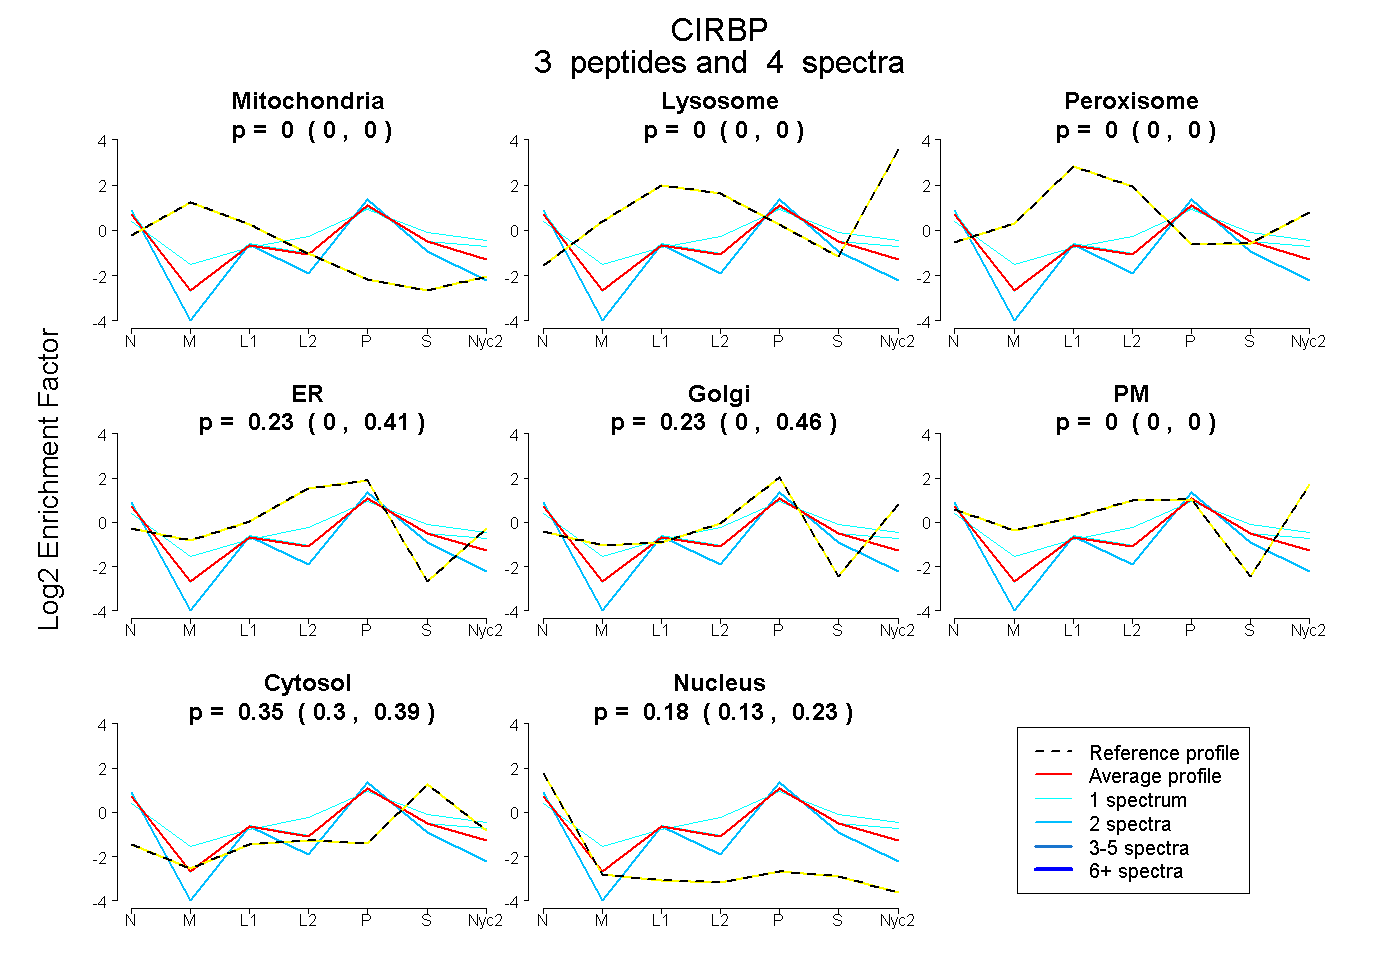
0.000 | 0.000
0.000 | 0.000
0.000 | 0.000
0.000 | 0.411
0.000 | 0.461
0.000 | 0.000
0.296 | 0.391
0.127 | 0.226
| Plot | Mito | Lyso | Perox | ER | Golgi | PM | Cytosol | Nucleus | |||||
| Expt A |
3 peptides |
4 spectra |
|
0.000 0.000 | 0.000 |
0.000 0.000 | 0.000 |
0.000 0.000 | 0.000 |
0.234 0.000 | 0.411 |
0.234 0.000 | 0.461 |
0.000 0.000 | 0.000 |
0.351 0.296 | 0.391 |
0.181 0.127 | 0.226 |
| 1 spectrum, GFGFVTFENIDDAK | 0.000 | 0.000 | 0.000 | 0.131 | 0.361 | 0.007 | 0.354 | 0.146 | ||
| 1 spectrum, SSGGSYR | 0.000 | 0.000 | 0.000 | 0.247 | 0.141 | 0.148 | 0.433 | 0.031 | ||
| 2 spectra, DSYDSYATHNE | 0.000 | 0.000 | 0.000 | 0.164 | 0.218 | 0.000 | 0.274 | 0.343 |
| Plot | Lyso | Other | |||||||||||
| Expt C |
1 peptide |
4 spectra |
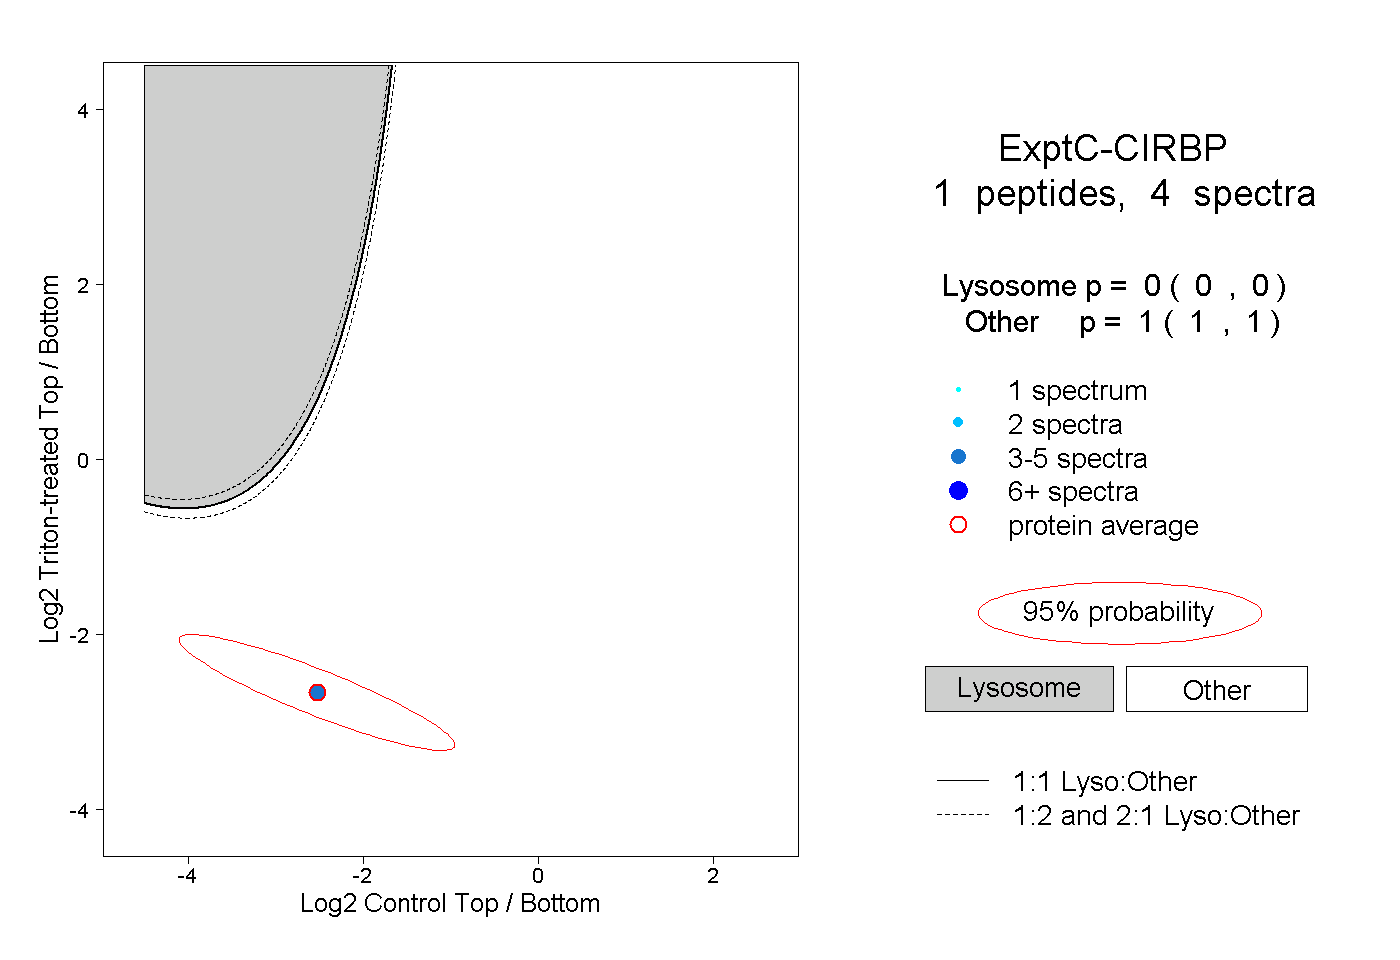 |
0.000 0.000 | 0.000 |
1.000 1.000 | 1.000 |