 33
33peptides
spectra
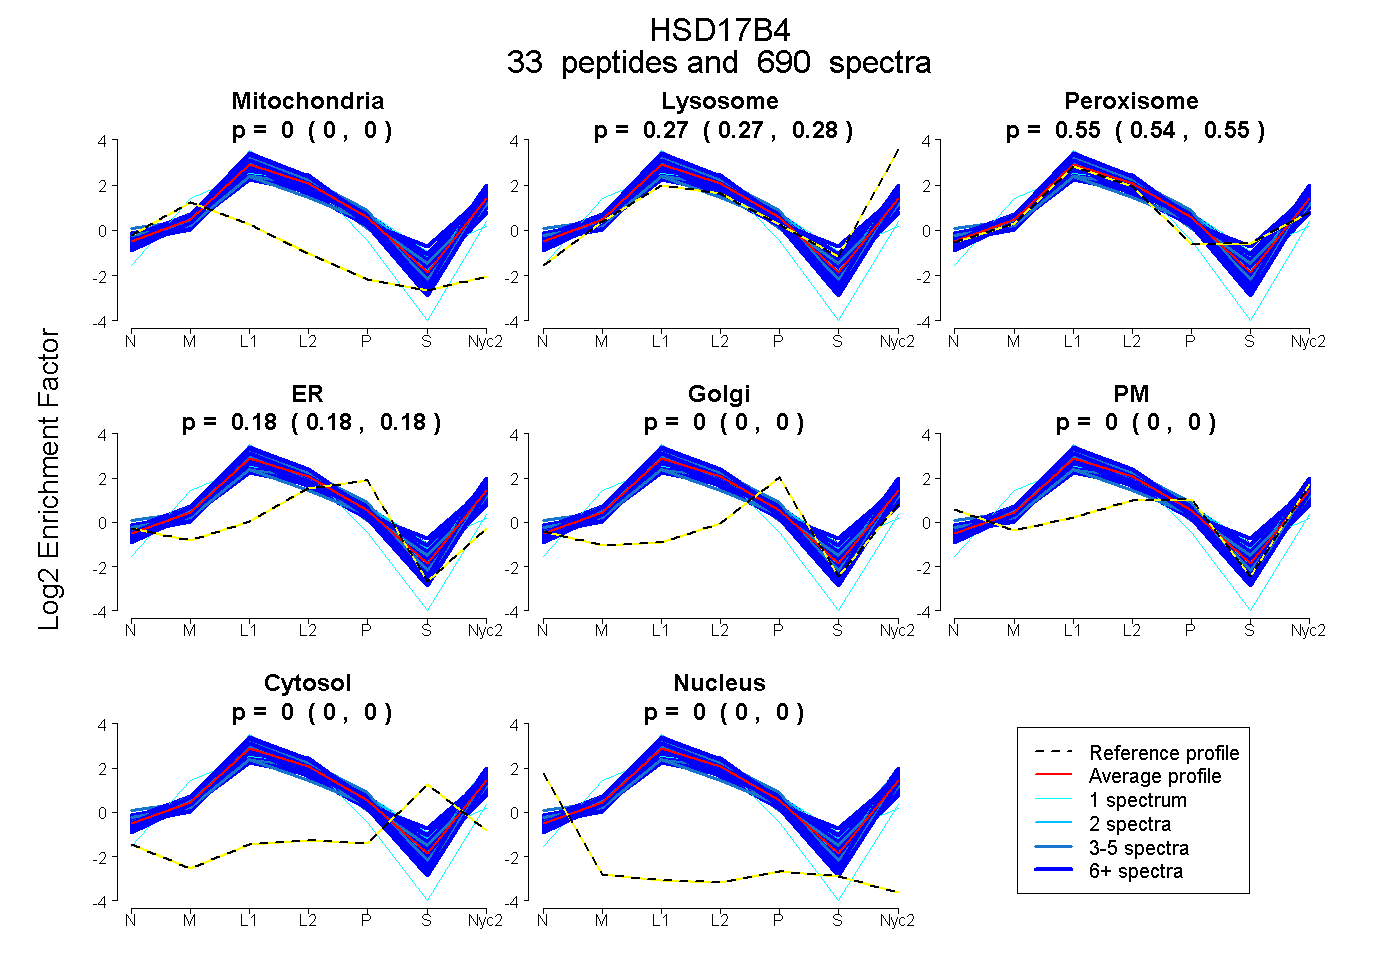
0.000 | 0.000
0.274 | 0.276
0.544 | 0.547
0.178 | 0.181
0.000 | 0.000
0.000 | 0.000
0.000 | 0.000
0.000 | 0.000
31peptides
spectra
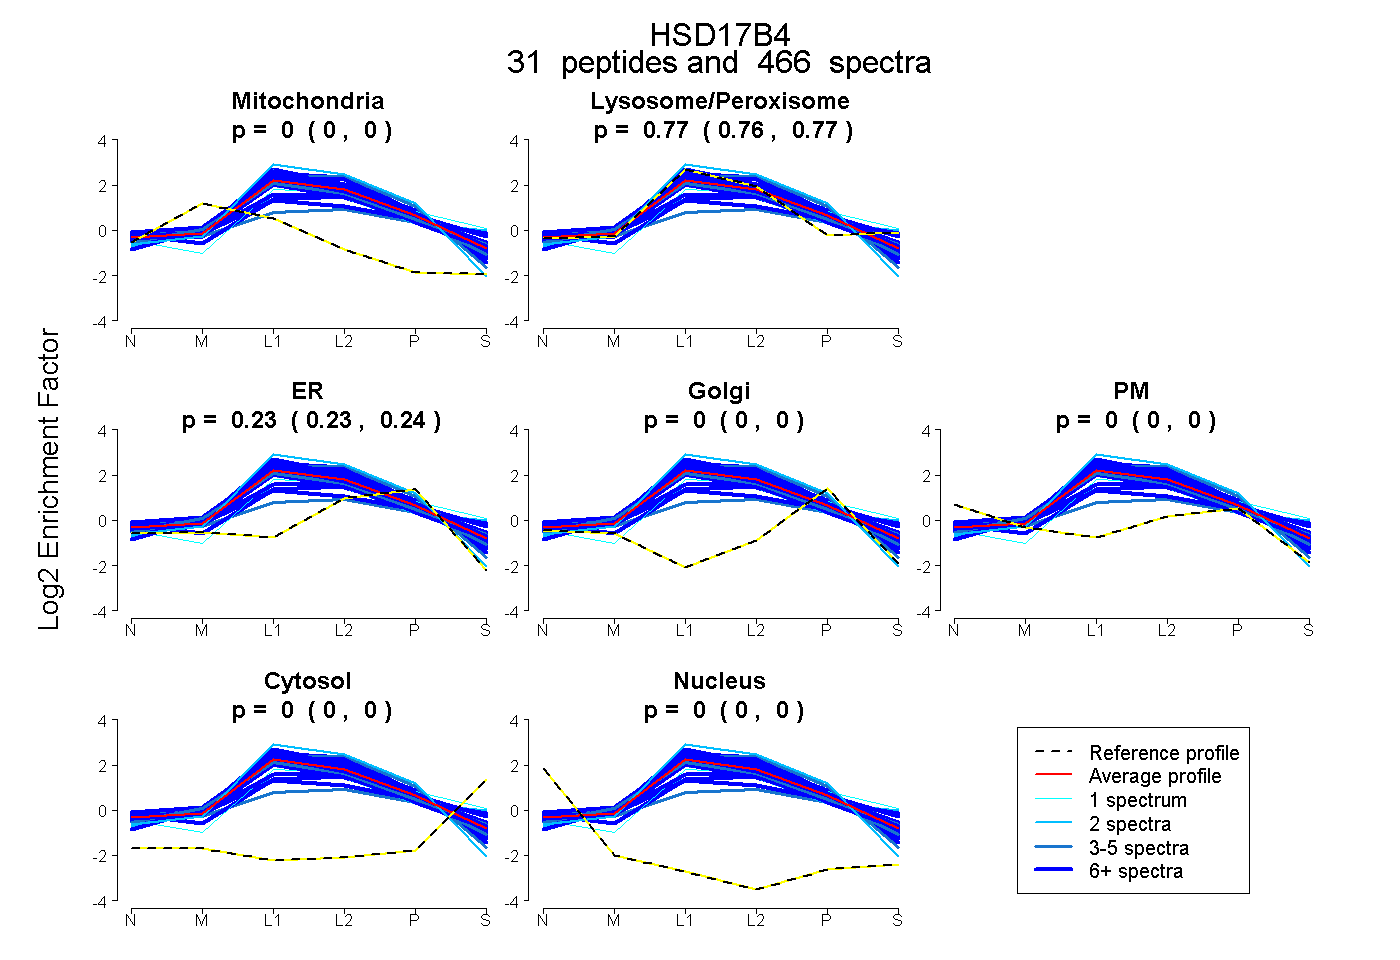
0.000 | 0.000
0.764 | 0.766
0.234 | 0.236
0.000 | 0.000
0.000 | 0.000
0.000 | 0.000
0.000 | 0.000
36peptides
spectra
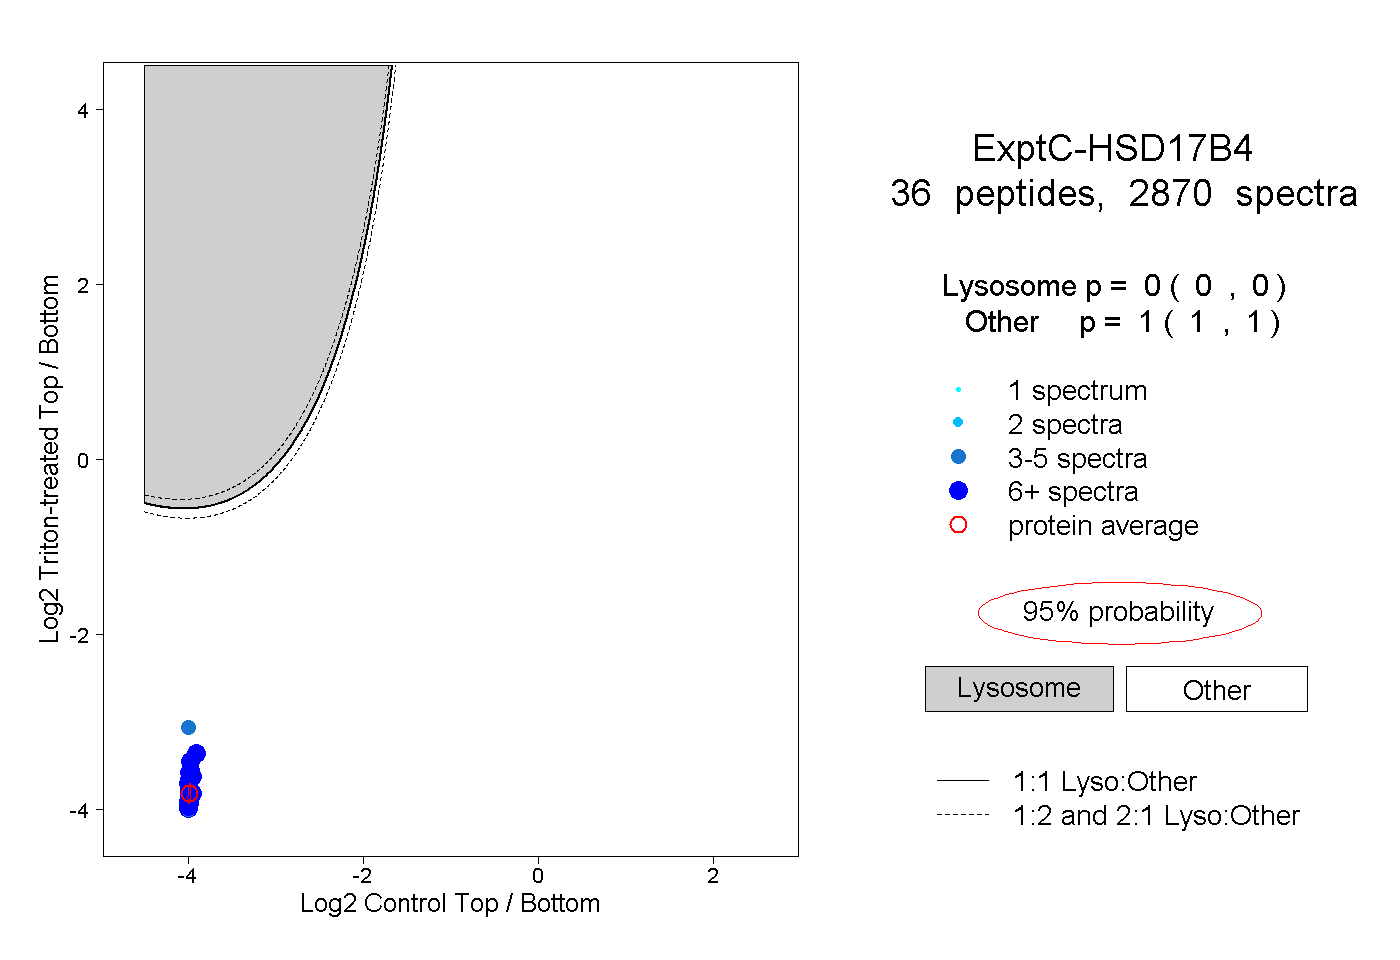
0.000 | 0.000
1.000 | 1.000
28peptides
spectra
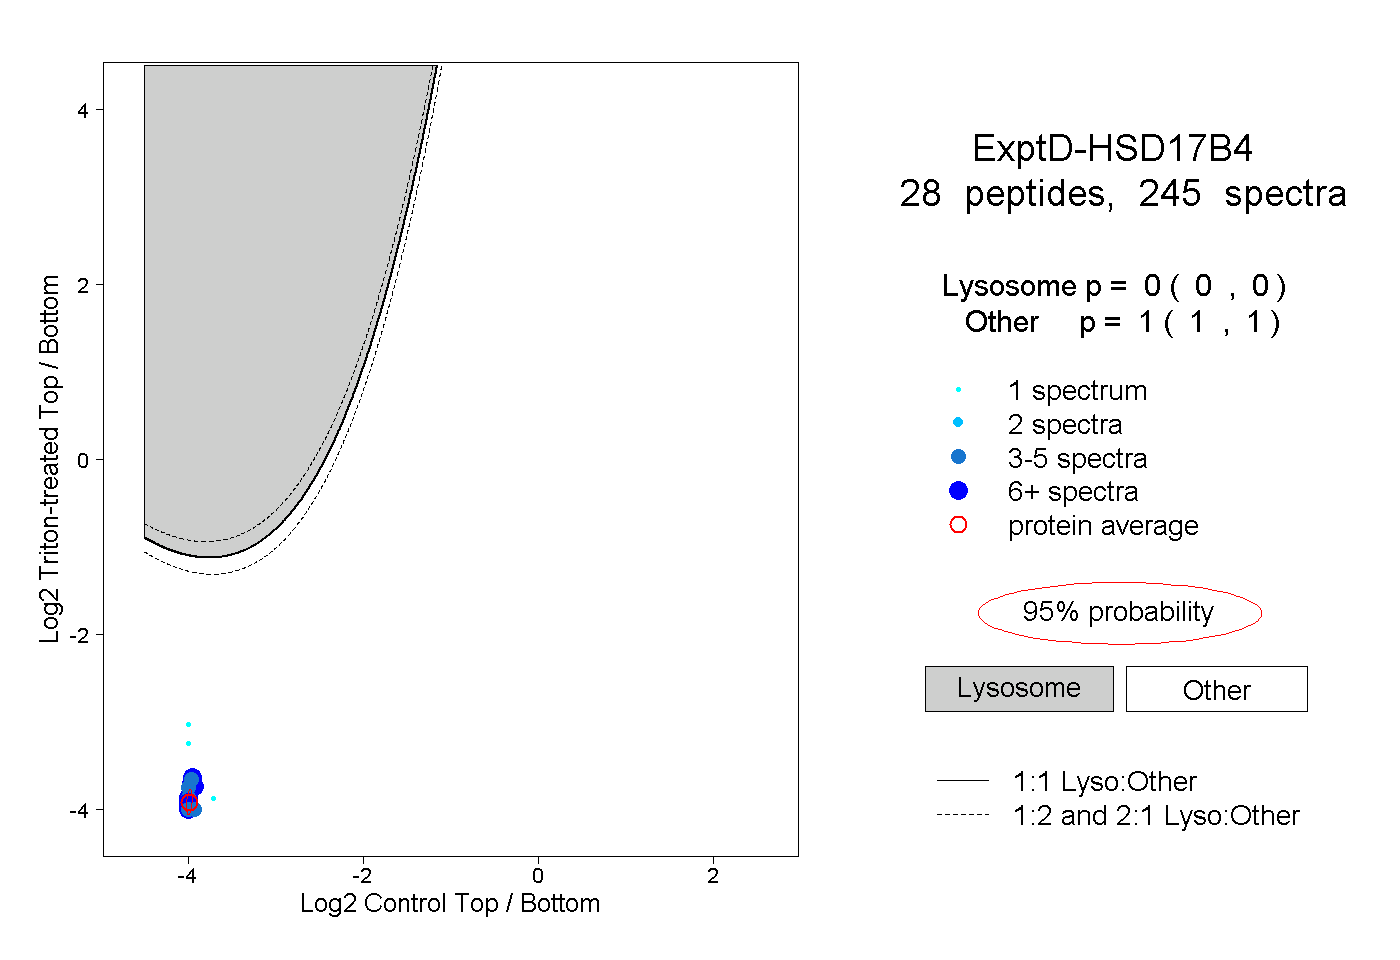
0.000 | 0.000
1.000 | 1.000