 7
7peptides
spectra
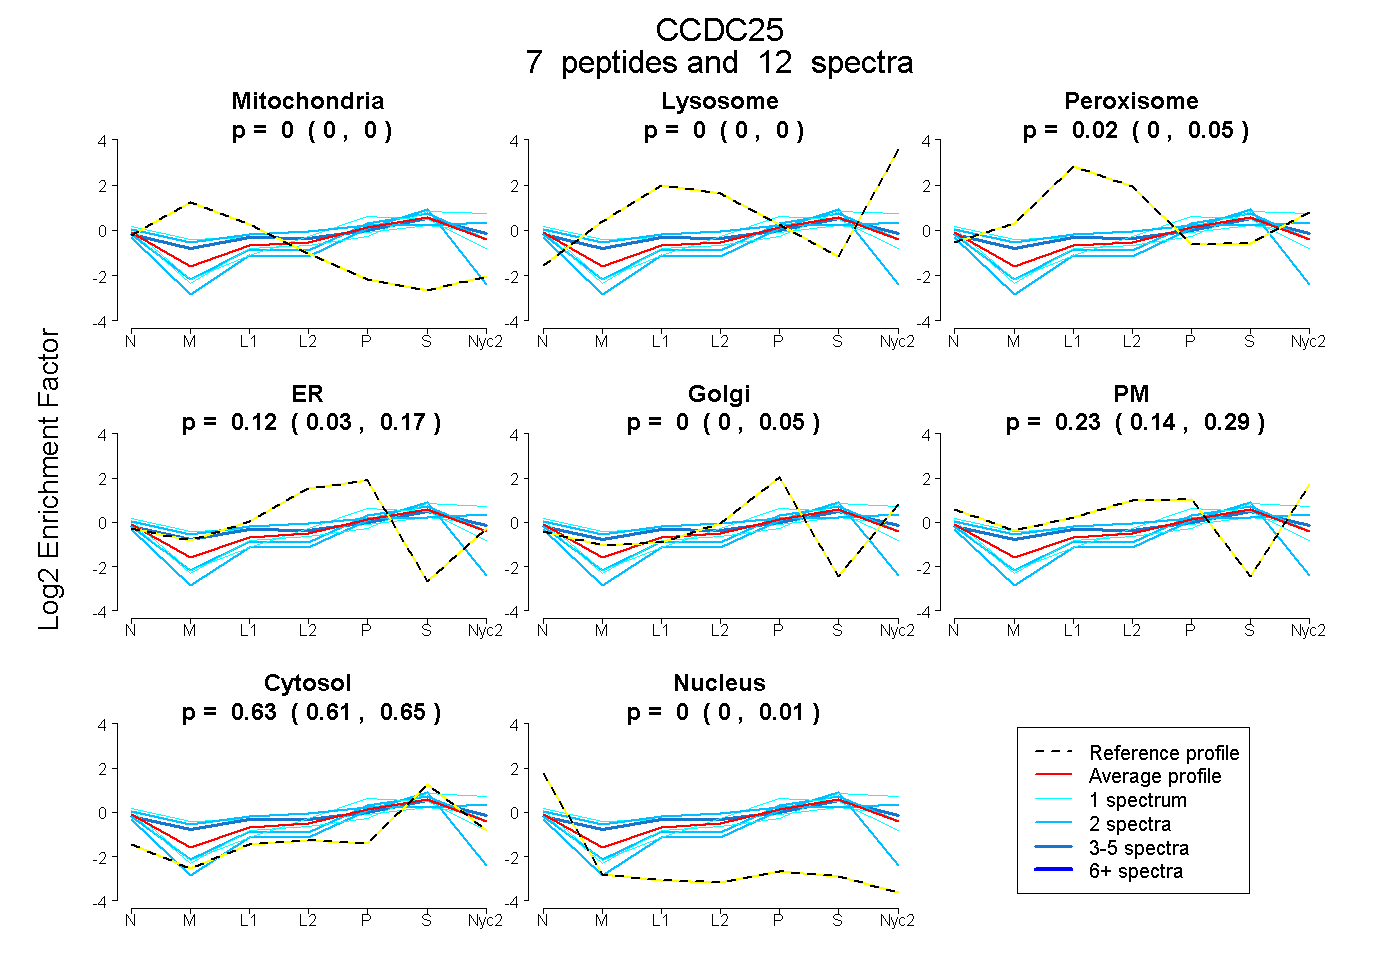
0.000 | 0.000
0.000 | 0.000
0.000 | 0.054
0.026 | 0.173
0.000 | 0.048
0.141 | 0.286
0.606 | 0.646
0.000 | 0.007
4peptides
spectra
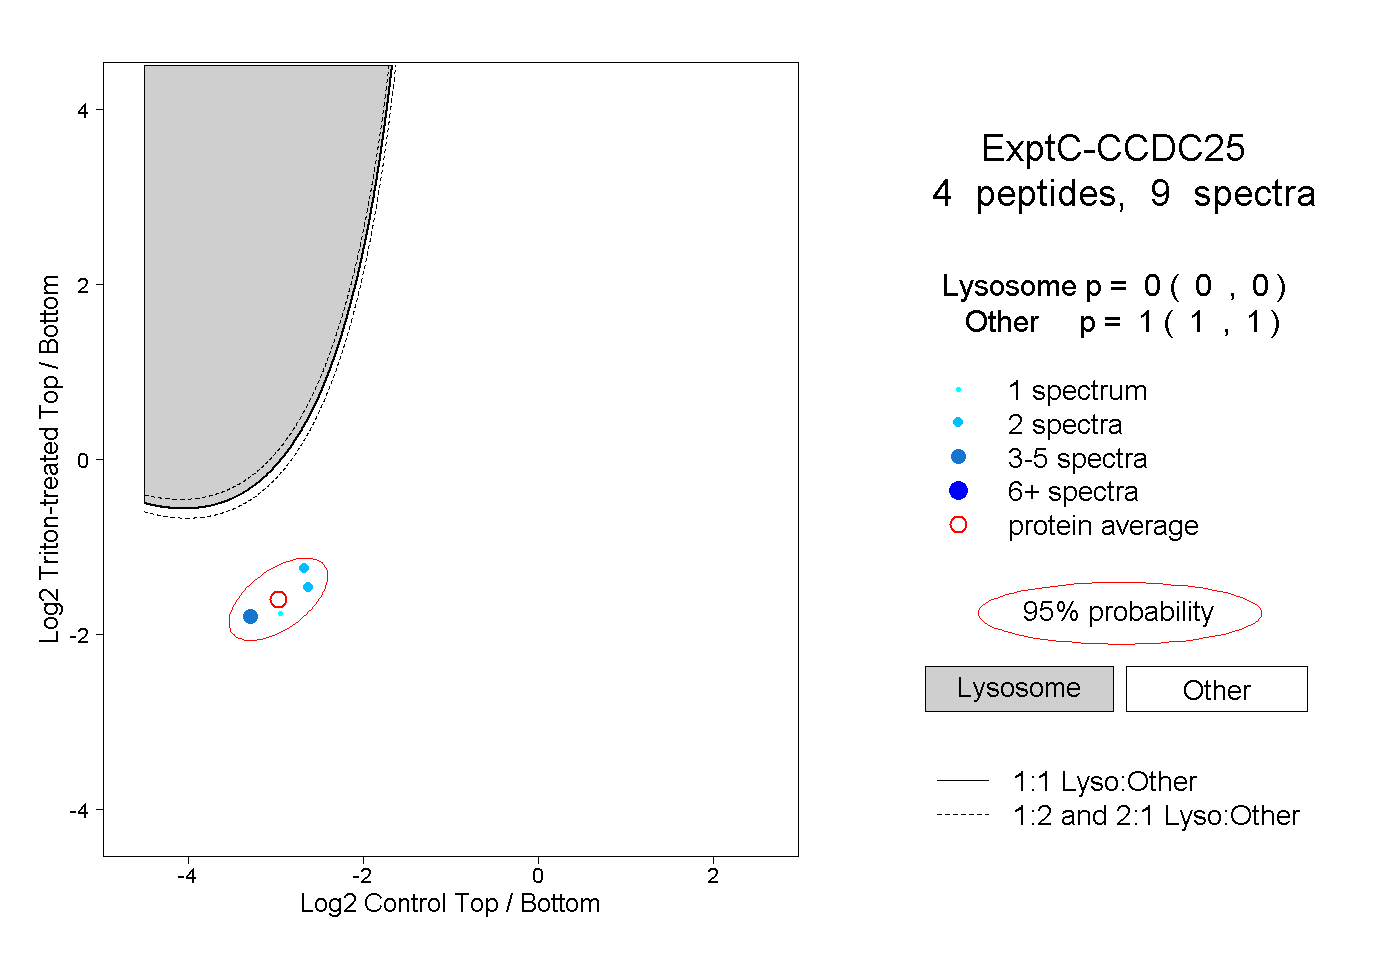
0.000 | 0.000
1.000 | 1.000
1peptide
spectrum
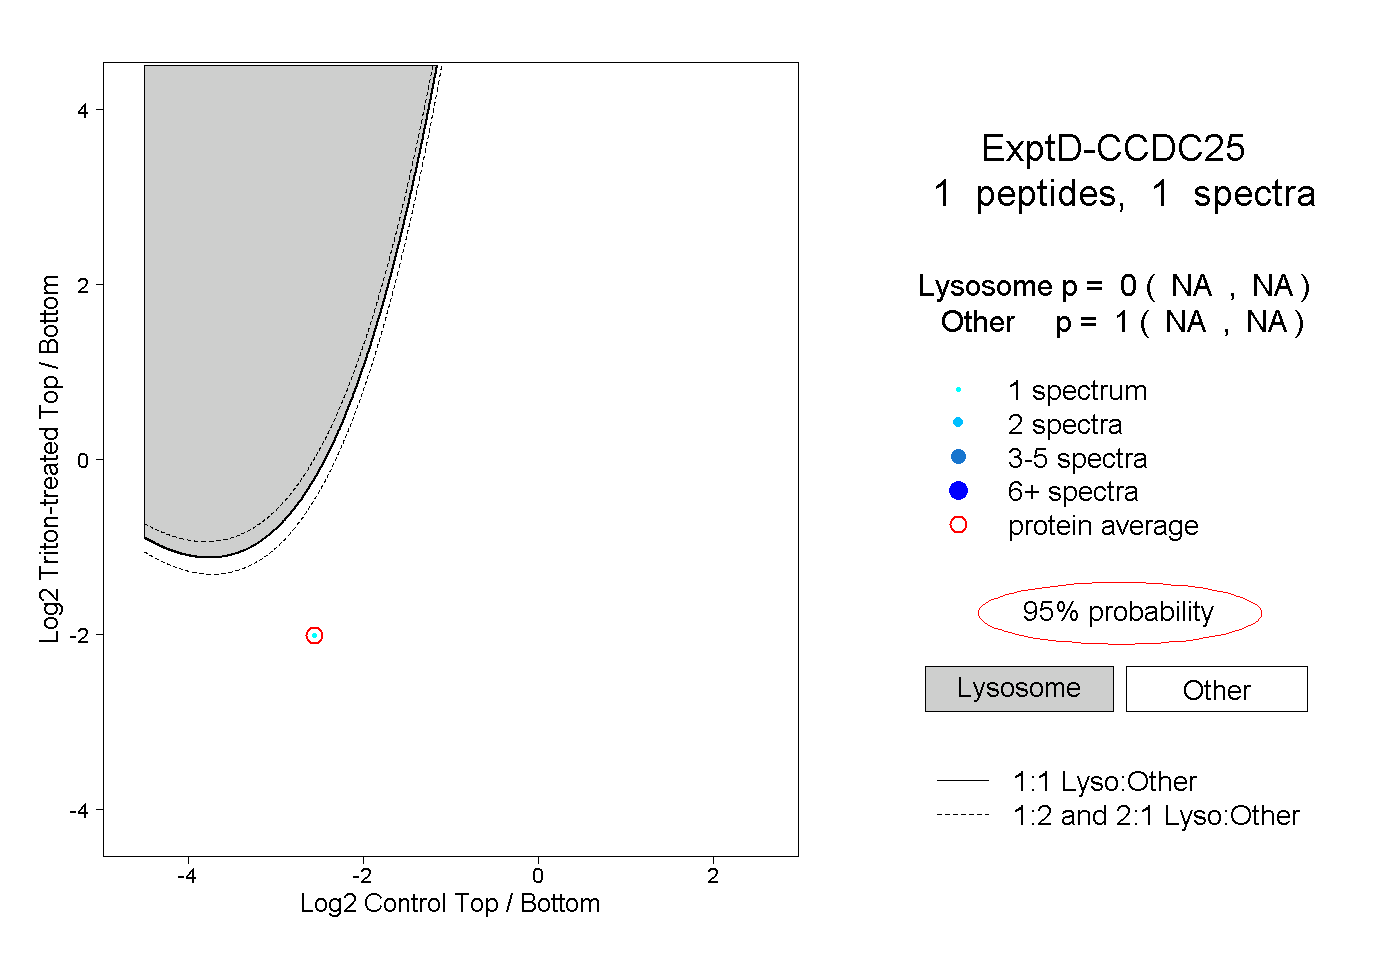
NA | NA
NA | NA