 7
7peptides
spectra
0.000 | 0.000
0.000 | 0.000
0.000 | 0.054
0.026 | 0.173
0.000 | 0.048
0.141 | 0.286
0.606 | 0.646
0.000 | 0.007
4peptides
spectra
0.000 | 0.000
1.000 | 1.000
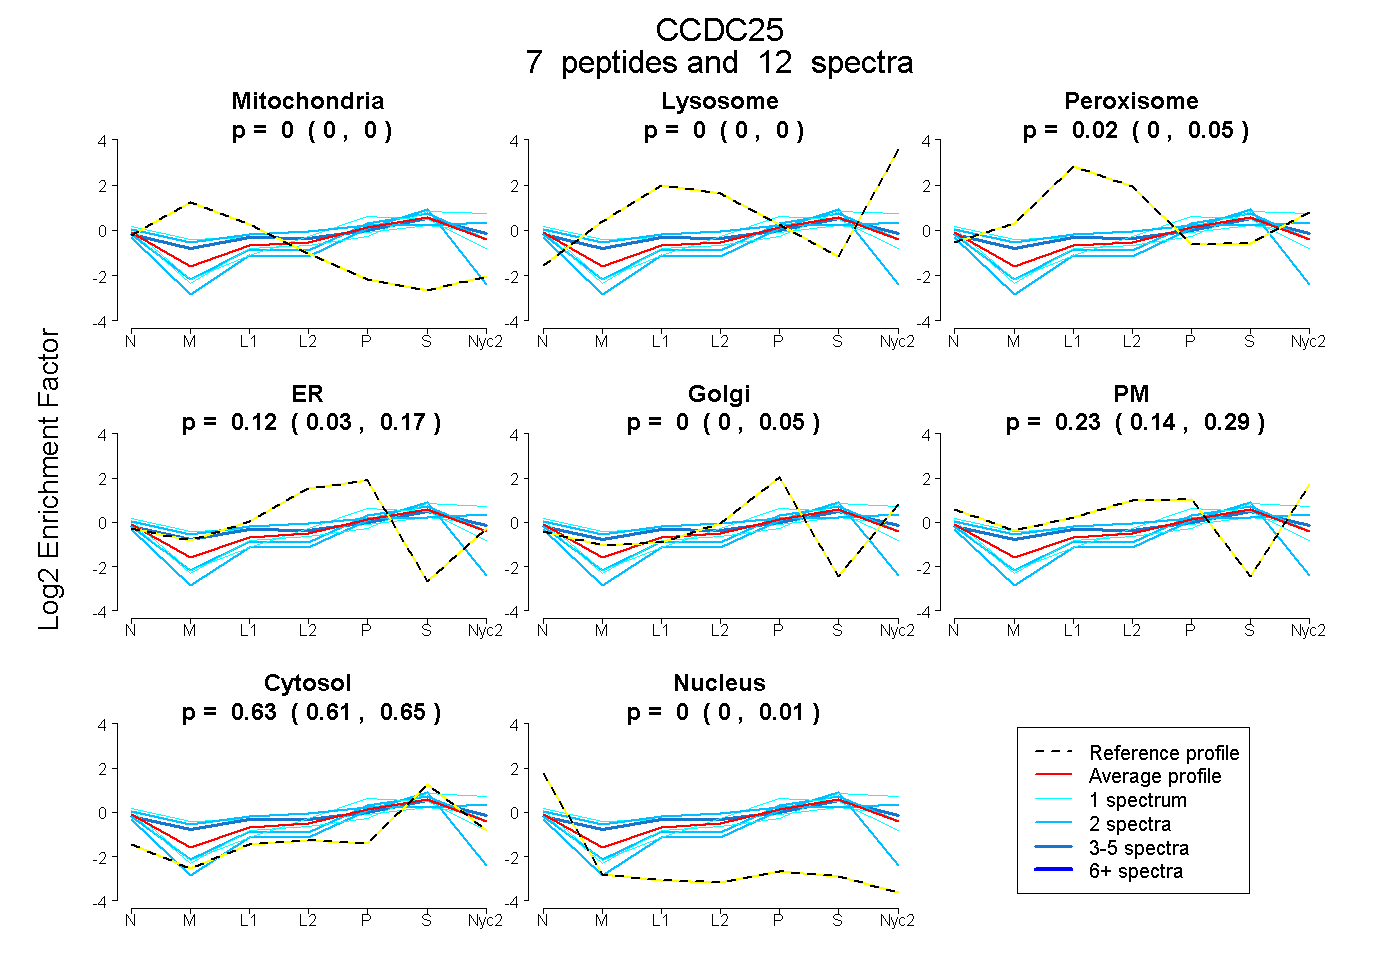
| Plot | Mito | Lyso | Perox | ER | Golgi | PM | Cytosol | Nucleus | |||||
| Expt A |
7 peptides |
12 spectra |
|
0.000 0.000 | 0.000 |
0.000 0.000 | 0.000 |
0.023 0.000 | 0.054 |
0.117 0.026 | 0.173 |
0.000 0.000 | 0.048 |
0.228 0.141 | 0.286 |
0.632 0.606 | 0.646 |
0.000 0.000 | 0.007 |
||
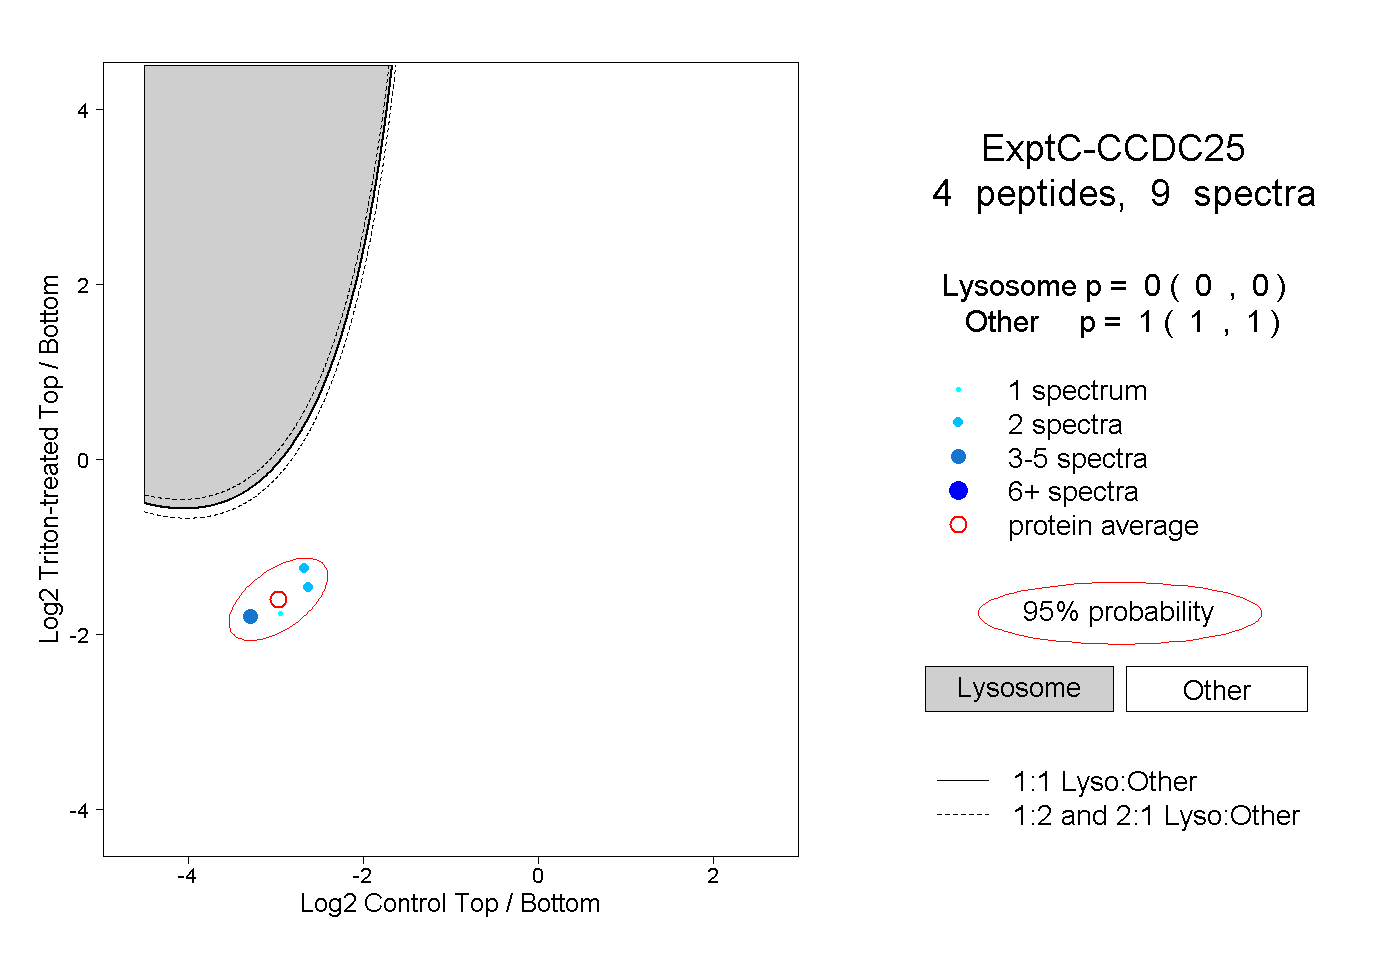
| Plot | Lyso | Other | |||||||||||
| Expt C |
4 peptides |
9 spectra |
|
0.000 0.000 | 0.000 |
1.000 1.000 | 1.000 |
| 4 spectra, TADMDVGQIGFHR | 0.000 | 1.000 | ||||||||
| 1 spectrum, LSSAHVYLR | 0.000 | 1.000 | ||||||||
| 2 spectra, FPDLAAEK | 0.000 | 1.000 | ||||||||
| 2 spectra, ANSIQGCK | 0.000 | 1.000 |
| Plot | Lyso | Other | |||||||||||
| Expt D |
1 peptide |
1 spectrum |
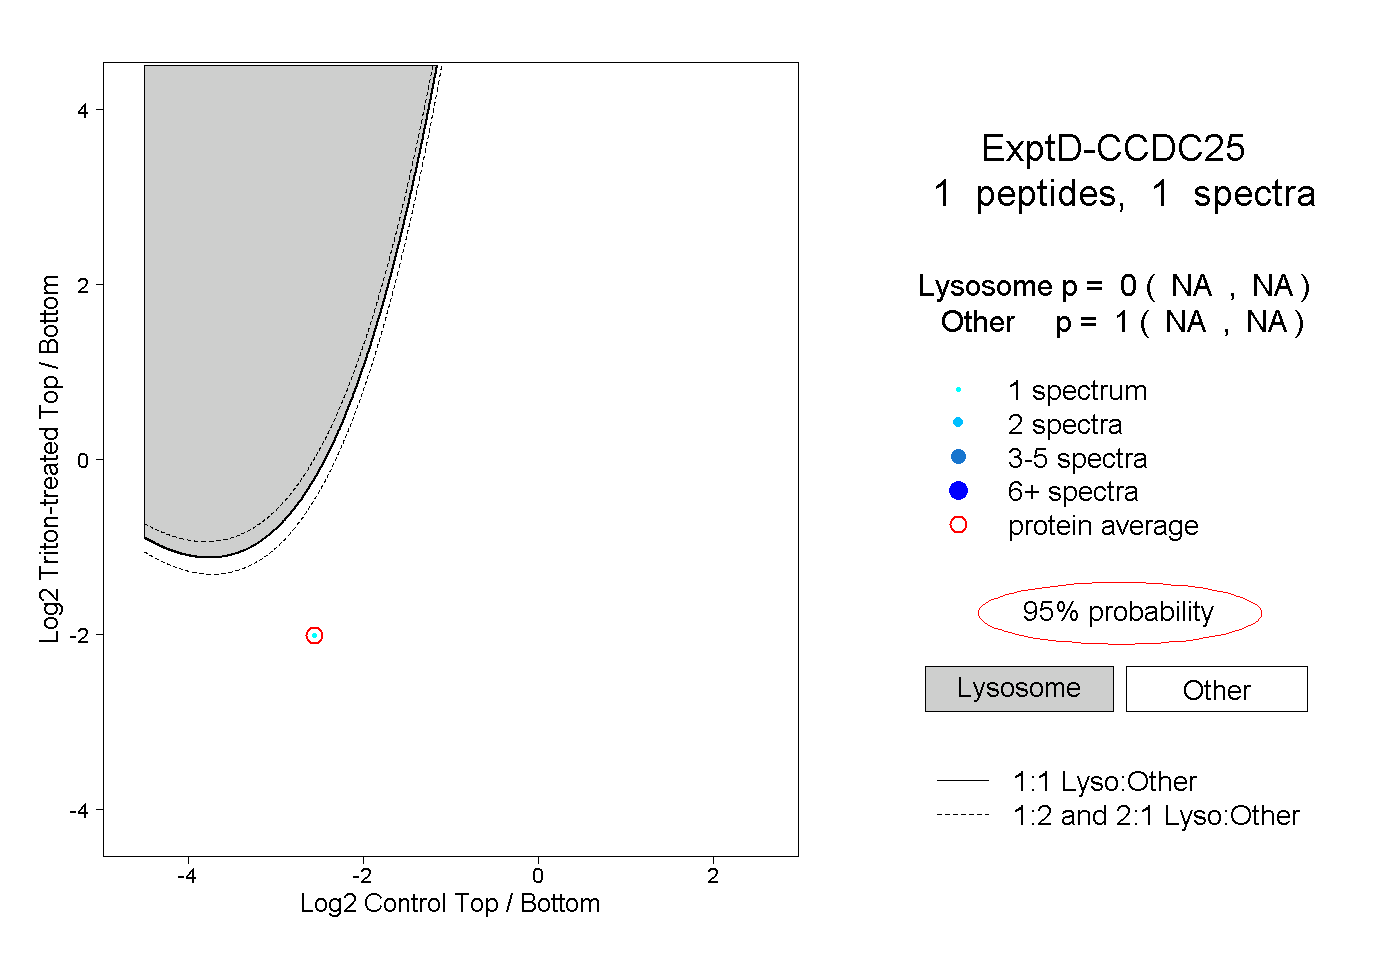 |
0.000 NA | NA |
1.000 NA | NA |