 13
13peptides
spectra
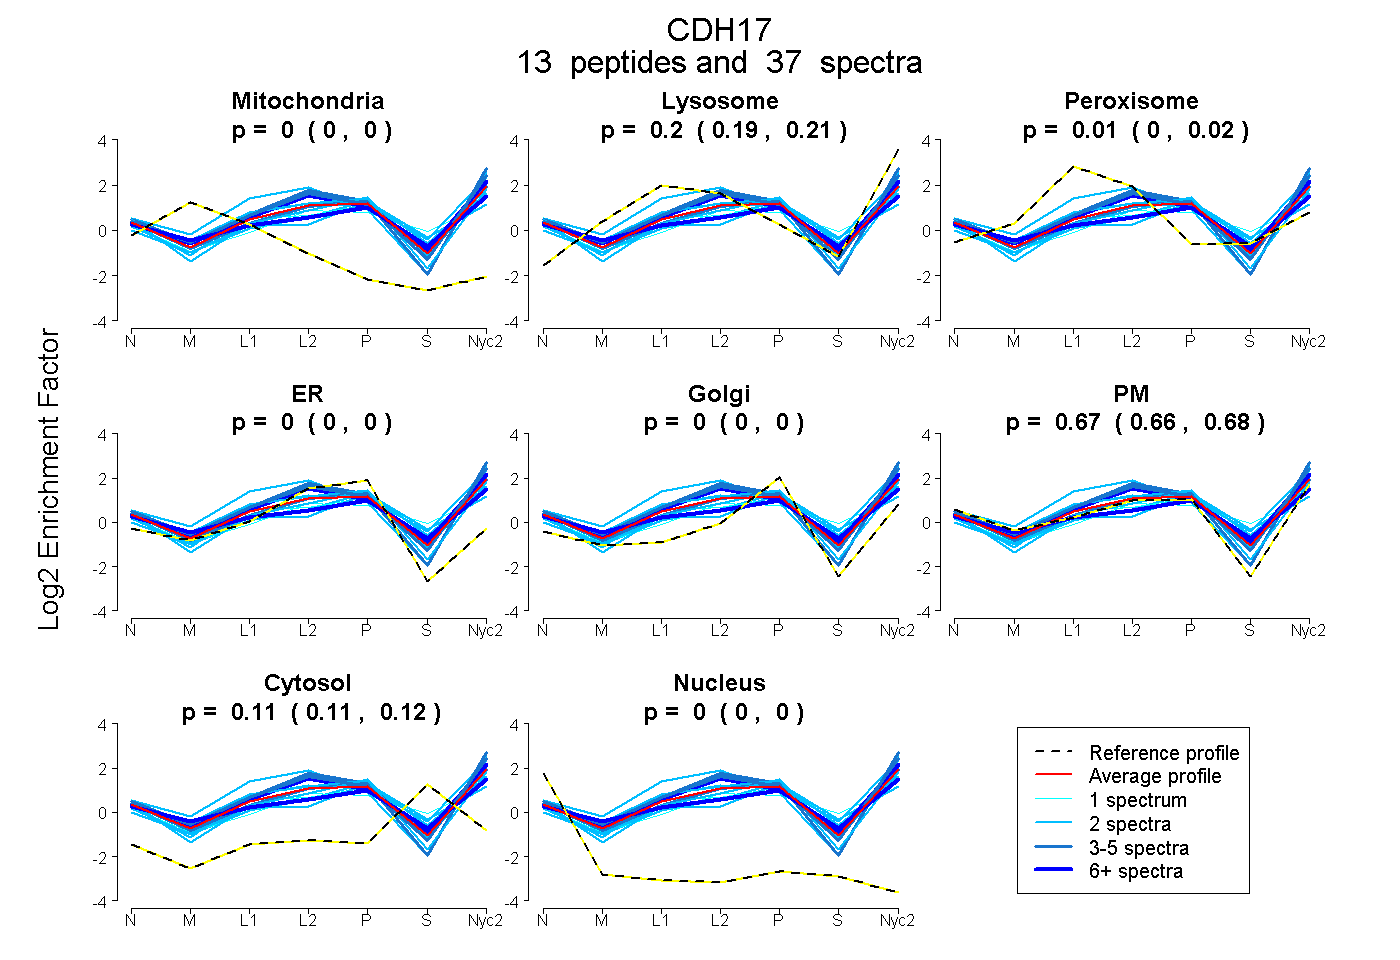
0.000 | 0.000
0.188 | 0.212
0.000 | 0.025
0.000 | 0.000
0.000 | 0.000
0.661 | 0.682
0.106 | 0.118
0.000 | 0.000
3peptides
spectra
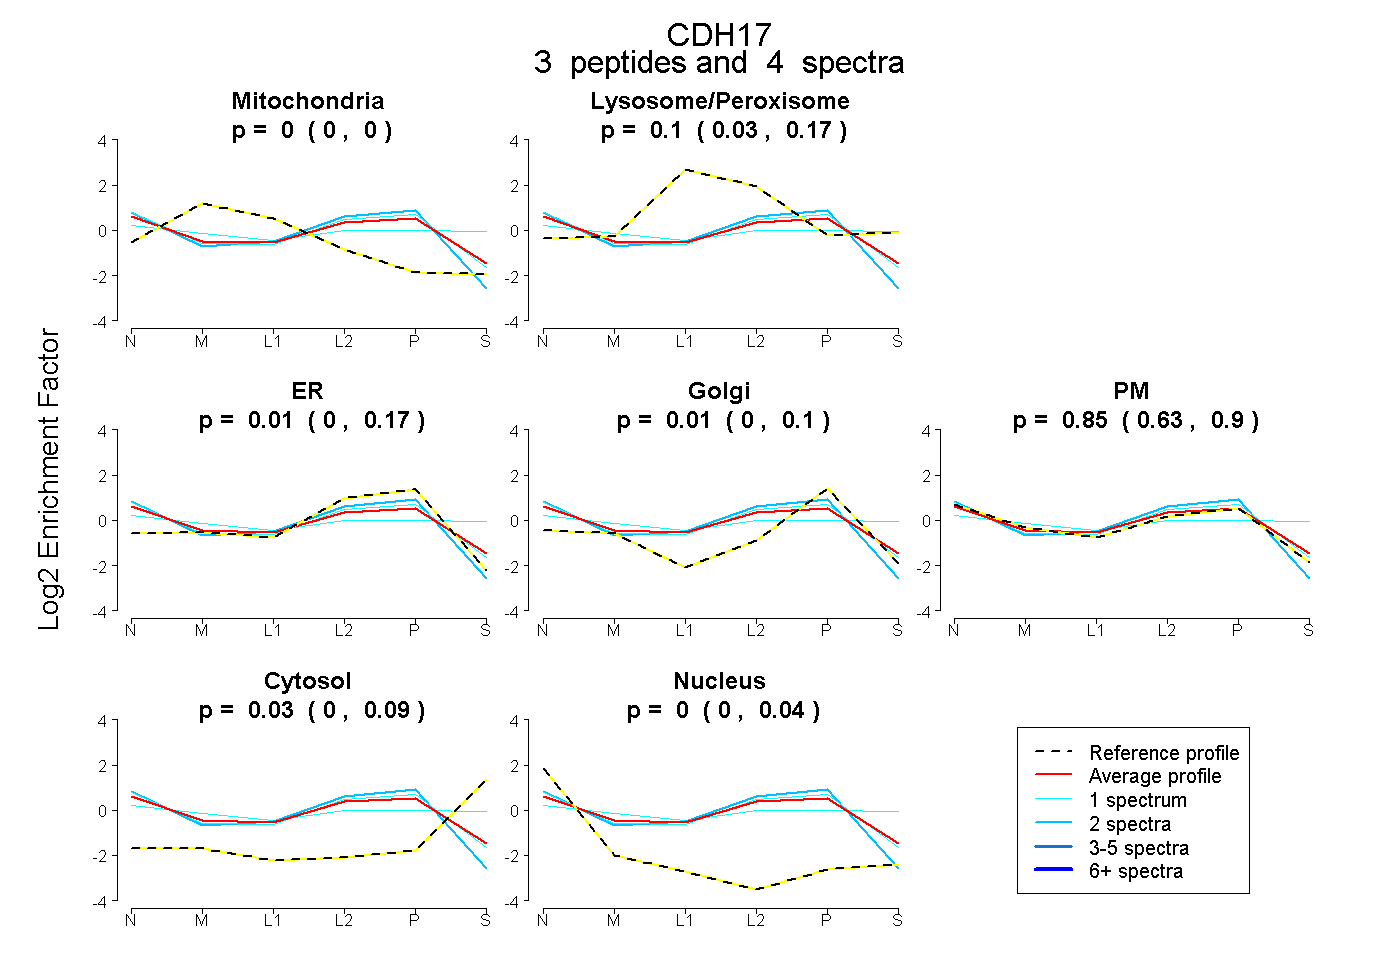
0.000 | 0.000
0.031 | 0.170
0.000 | 0.171
0.000 | 0.104
0.633 | 0.898
0.000 | 0.087
0.000 | 0.041
17peptides
spectra
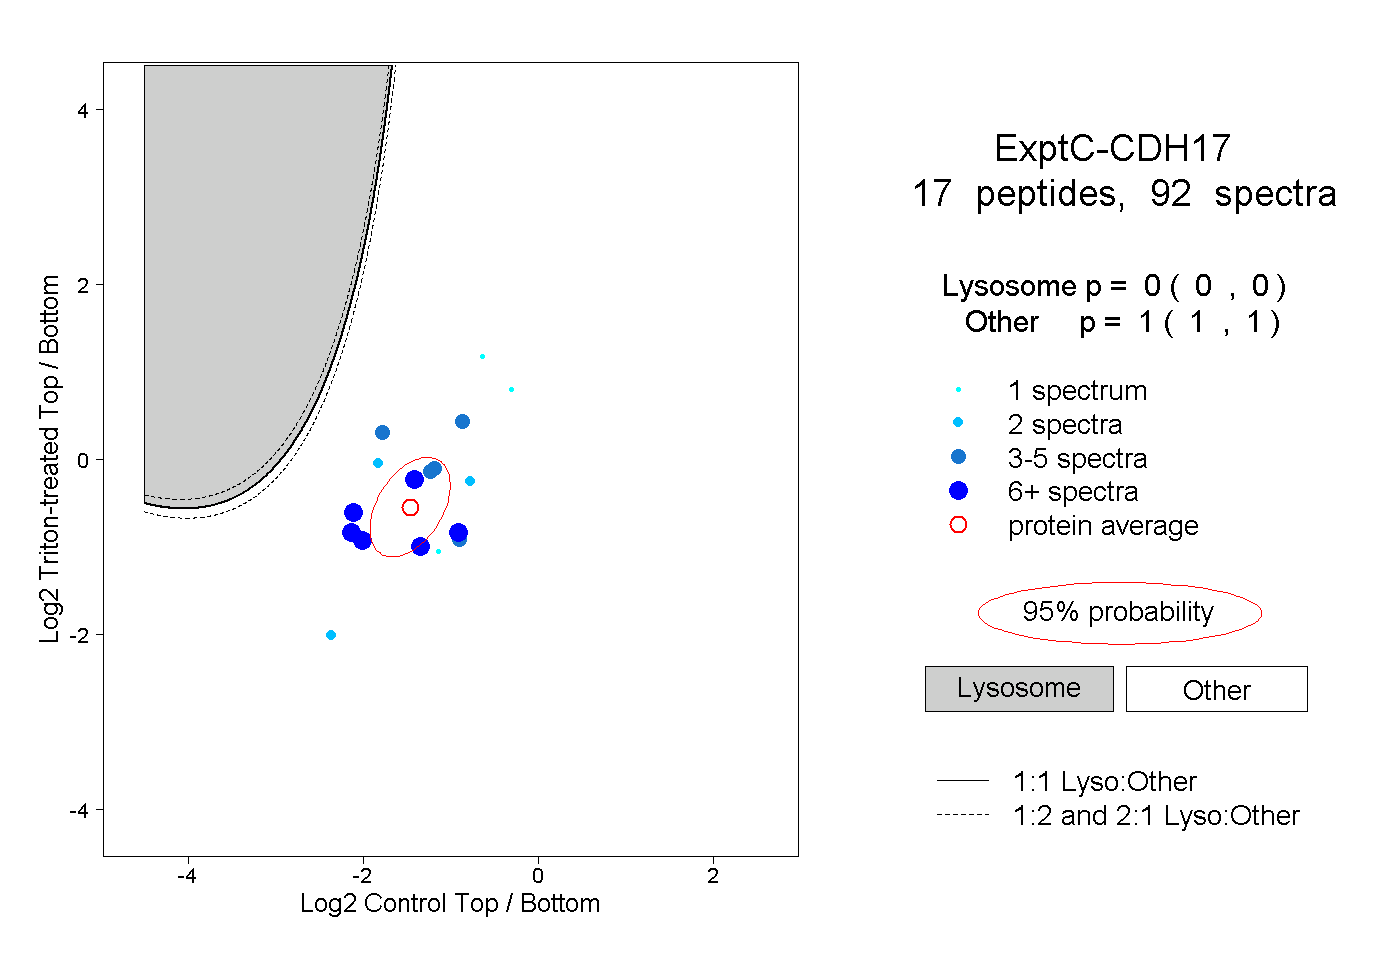
0.000 | 0.000
1.000 | 1.000
2peptides
spectra
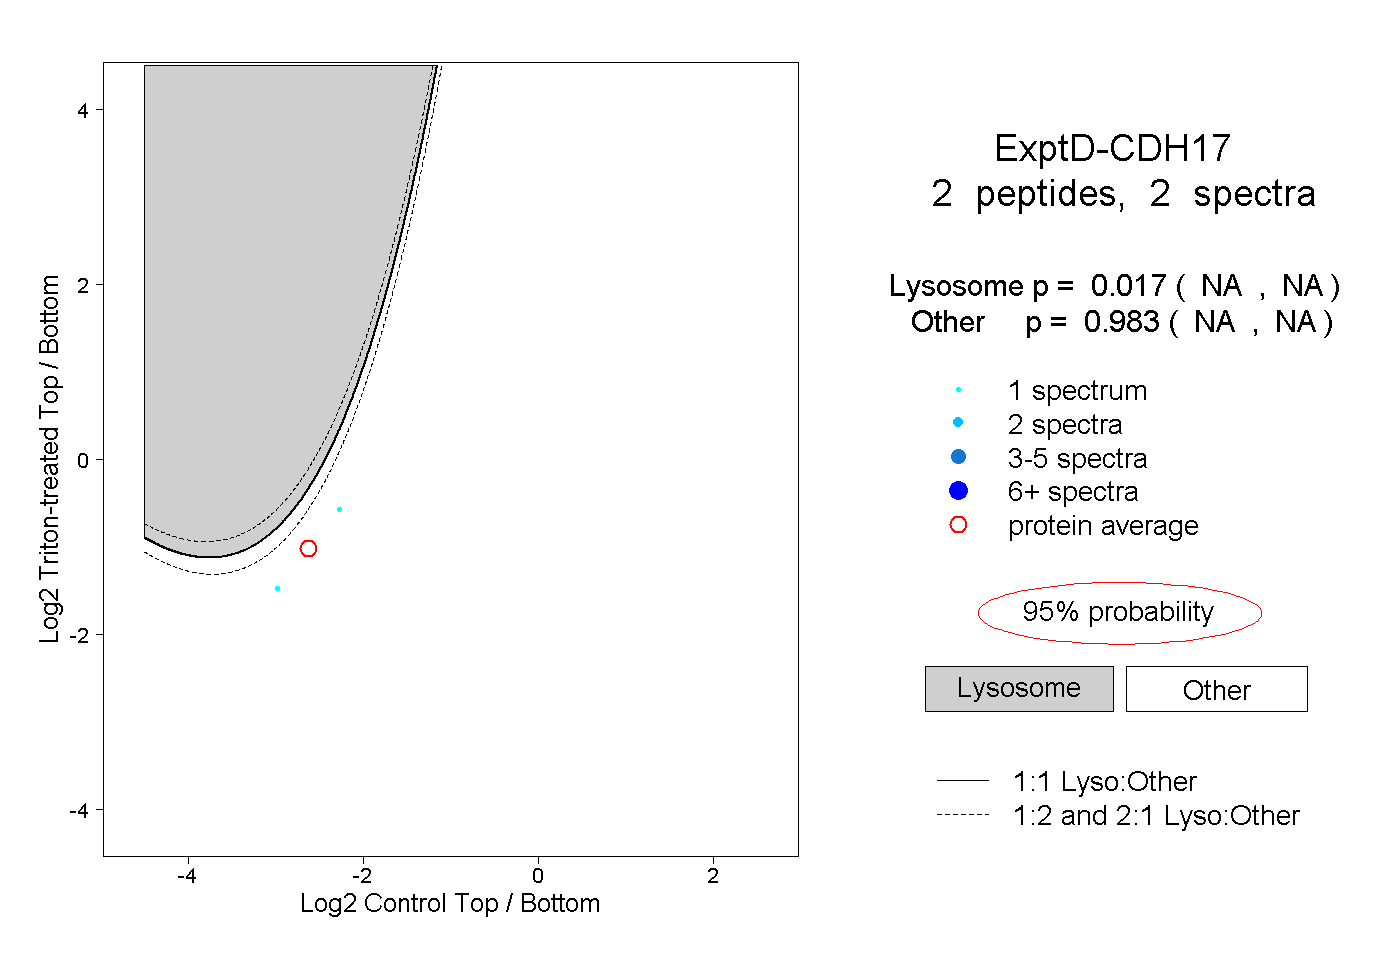
NA | NA
NA | NA