 13
13peptides
spectra
0.000 | 0.000
0.188 | 0.212
0.000 | 0.025
0.000 | 0.000
0.000 | 0.000
0.661 | 0.682
0.106 | 0.118
0.000 | 0.000
| Plot | Mito | Lyso | Perox | ER | Golgi | PM | Cytosol | Nucleus | |||||
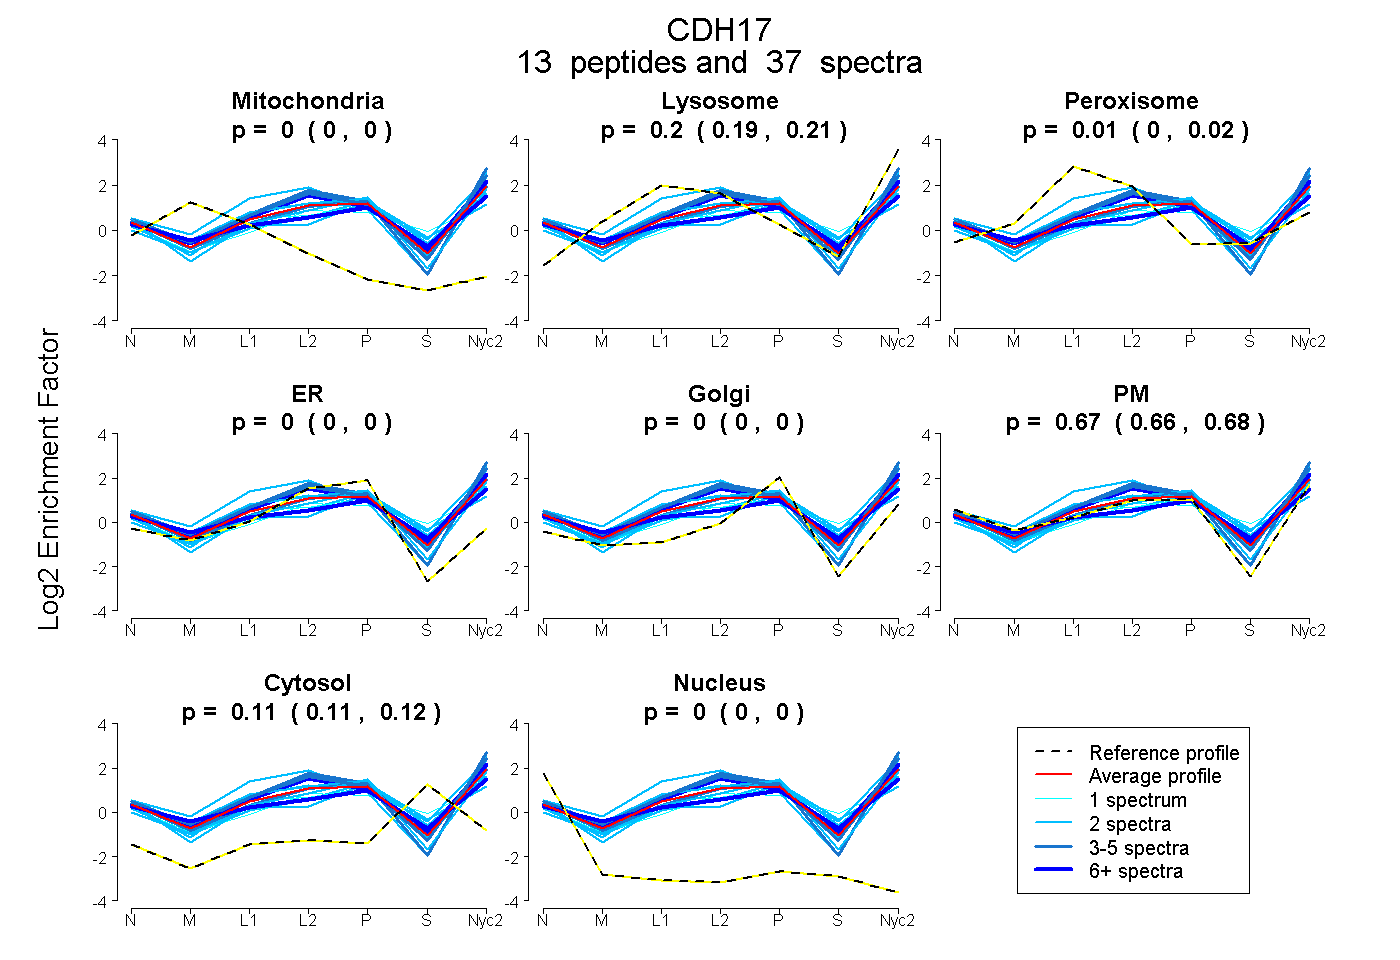
| Expt A |
13 peptides |
37 spectra |
|
0.000 0.000 | 0.000 |
0.201 0.188 | 0.212 |
0.013 0.000 | 0.025 |
0.000 0.000 | 0.000 |
0.000 0.000 | 0.000 |
0.673 0.661 | 0.682 |
0.112 0.106 | 0.118 |
0.000 0.000 | 0.000 |
| 3 spectra, IVQGDTEGR | 0.000 | 0.157 | 0.000 | 0.000 | 0.010 | 0.726 | 0.107 | 0.000 | ||
| 2 spectra, VEDPQSPENKPLR | 0.000 | 0.157 | 0.093 | 0.063 | 0.093 | 0.593 | 0.000 | 0.000 | ||
| 2 spectra, SDYGSK | 0.000 | 0.116 | 0.000 | 0.000 | 0.098 | 0.668 | 0.119 | 0.000 | ||
| 2 spectra, DSHVFFATAK | 0.000 | 0.120 | 0.123 | 0.000 | 0.319 | 0.217 | 0.221 | 0.000 | ||
| 1 spectrum, DENGKPLAYPLEIR | 0.000 | 0.170 | 0.000 | 0.000 | 0.000 | 0.703 | 0.126 | 0.000 | ||
| 2 spectra, APEPVEIR | 0.000 | 0.169 | 0.000 | 0.000 | 0.150 | 0.483 | 0.198 | 0.000 | ||
| 2 spectra, ETESVYR | 0.000 | 0.337 | 0.001 | 0.000 | 0.000 | 0.507 | 0.155 | 0.000 | ||
| 2 spectra, ESLQSDWEVSK | 0.000 | 0.308 | 0.085 | 0.000 | 0.000 | 0.606 | 0.000 | 0.000 | ||
| 3 spectra, IDSVTGDIFSTAPLDR | 0.000 | 0.264 | 0.000 | 0.000 | 0.000 | 0.736 | 0.000 | 0.000 | ||
| 4 spectra, VGTVTAR | 0.000 | 0.286 | 0.016 | 0.000 | 0.000 | 0.684 | 0.015 | 0.000 | ||
| 7 spectra, FTFALGR | 0.000 | 0.258 | 0.054 | 0.000 | 0.000 | 0.609 | 0.079 | 0.000 | ||
| 1 spectrum, DGLLYHTR | 0.000 | 0.071 | 0.093 | 0.000 | 0.000 | 0.534 | 0.302 | 0.000 | ||
| 6 spectra, YEGSVR | 0.000 | 0.130 | 0.049 | 0.000 | 0.020 | 0.609 | 0.192 | 0.000 |
| Plot | Mito | Lyso or Perox | ER | Golgi | PM | Cytosol | Nucleus | ||||||
| Expt B |
3 peptides |
4 spectra |
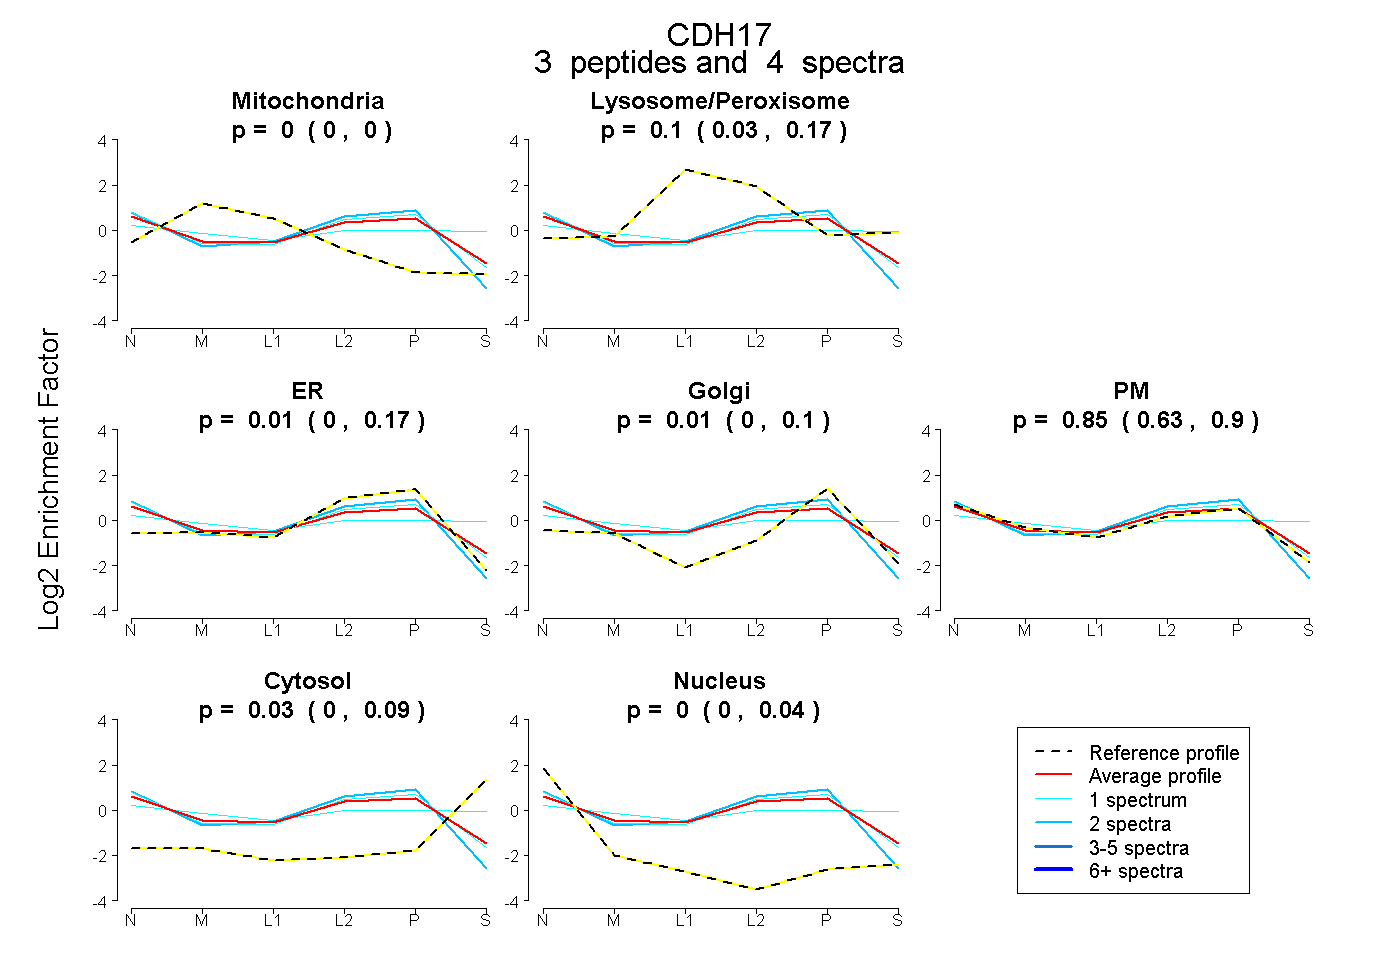 |
0.000 0.000 | 0.000 |
0.104 0.031 | 0.170 |
0.013 0.000 | 0.171 |
0.007 0.000 | 0.104 |
0.849 0.633 | 0.898 |
0.026 0.000 | 0.087 |
0.000 0.000 | 0.041 |
|||
| Plot | Lyso | Other | |||||||||||
| Expt C |
17 peptides |
92 spectra |
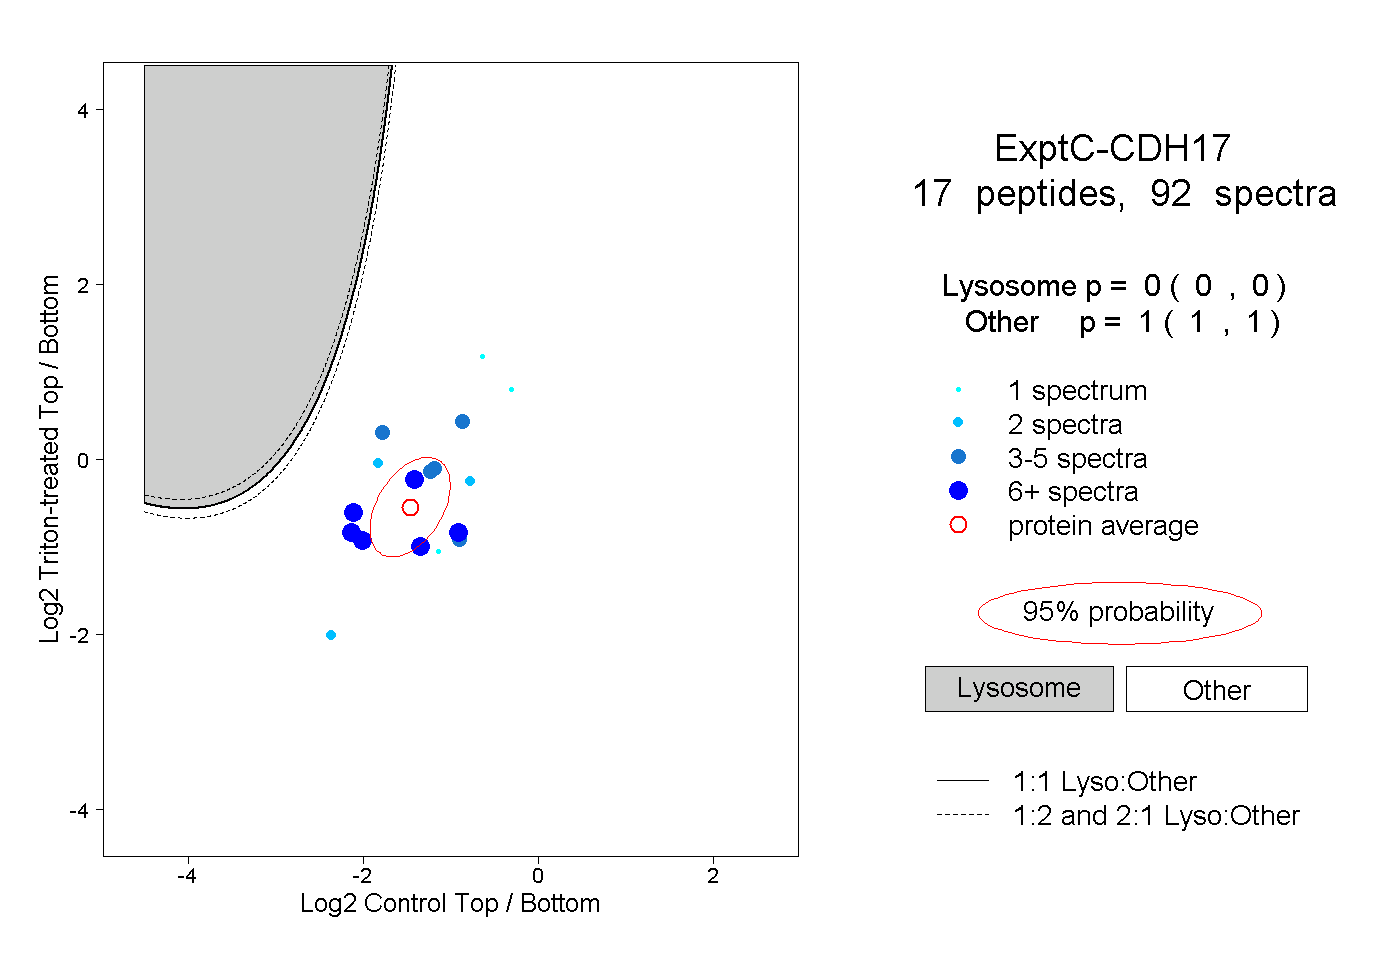 |
0.000 0.000 | 0.000 |
1.000 1.000 | 1.000 |
||||||||
| Plot | Lyso | Other | |||||||||||
| Expt D |
2 peptides |
2 spectra |
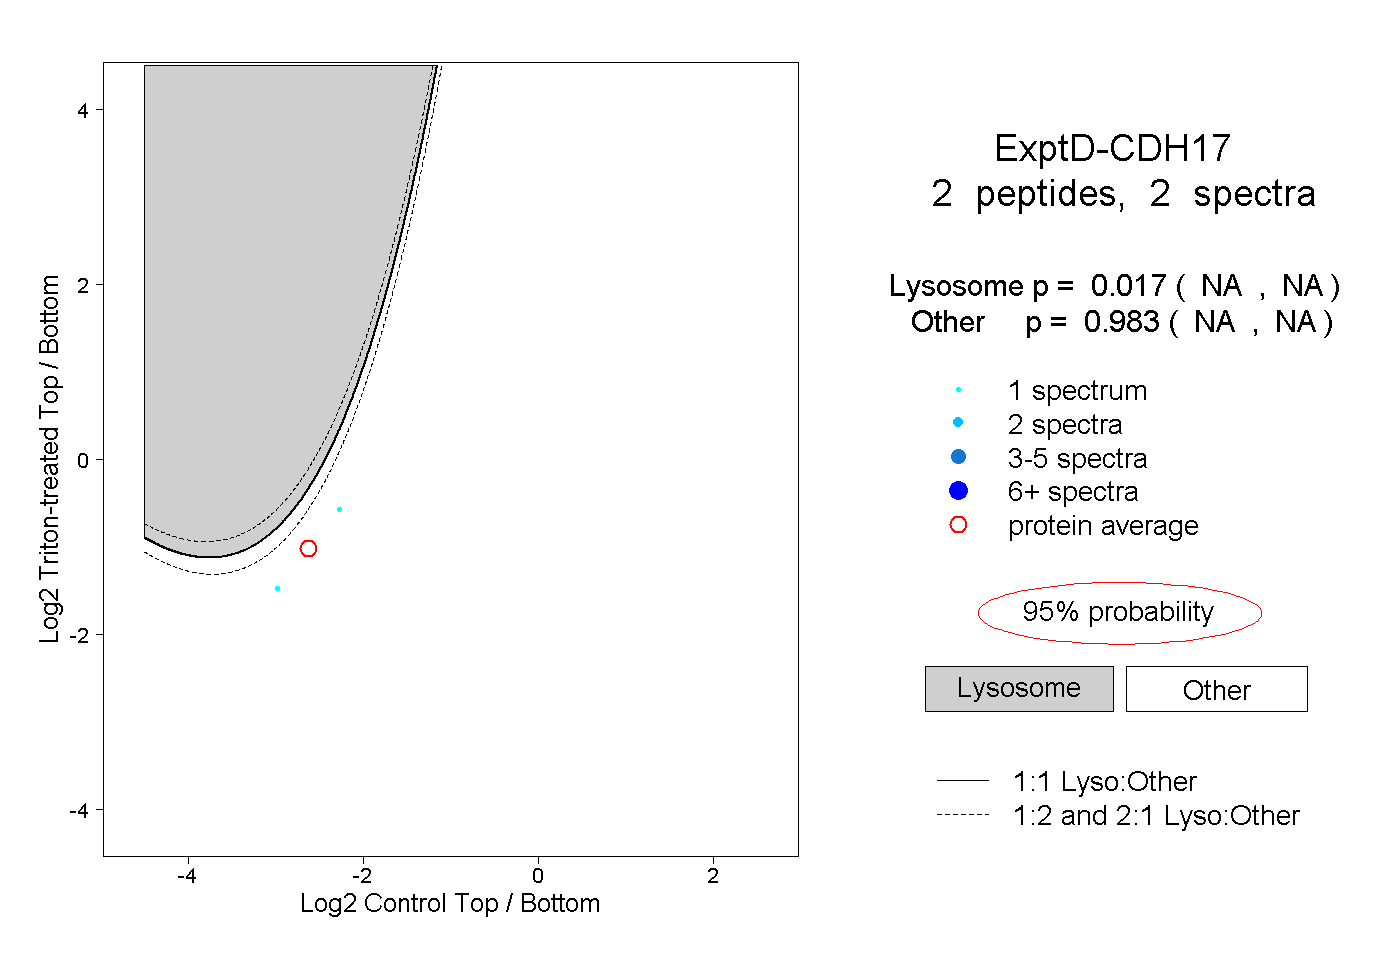 |
0.017 NA | NA |
0.983 NA | NA |