 8
8peptides
spectra
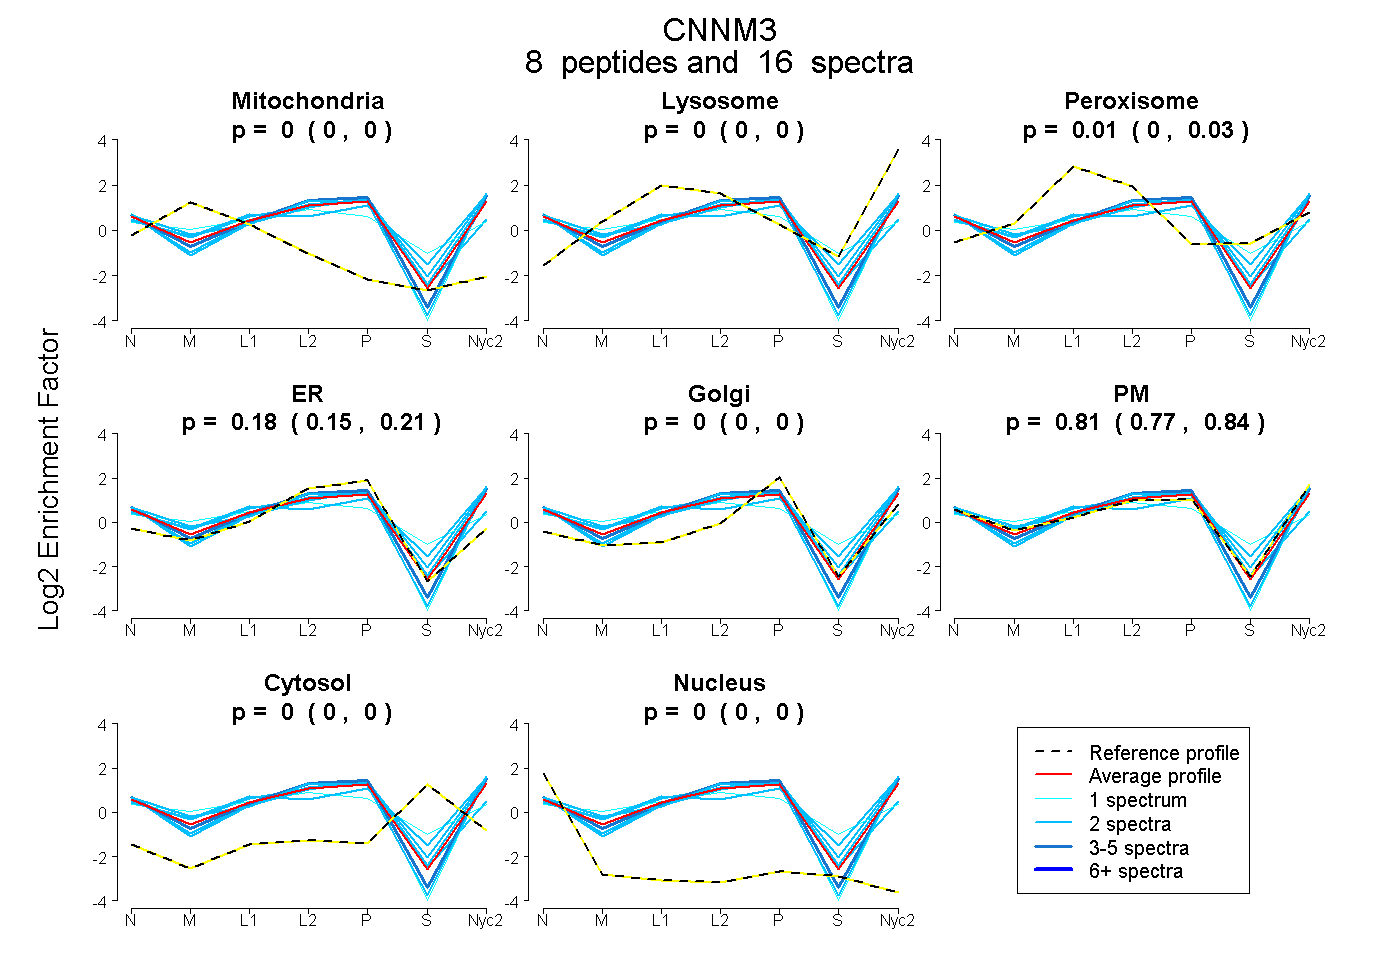
0.000 | 0.000
0.000 | 0.000
0.000 | 0.034
0.147 | 0.207
0.000 | 0.000
0.770 | 0.835
0.000 | 0.000
0.000 | 0.002
1peptide
spectra
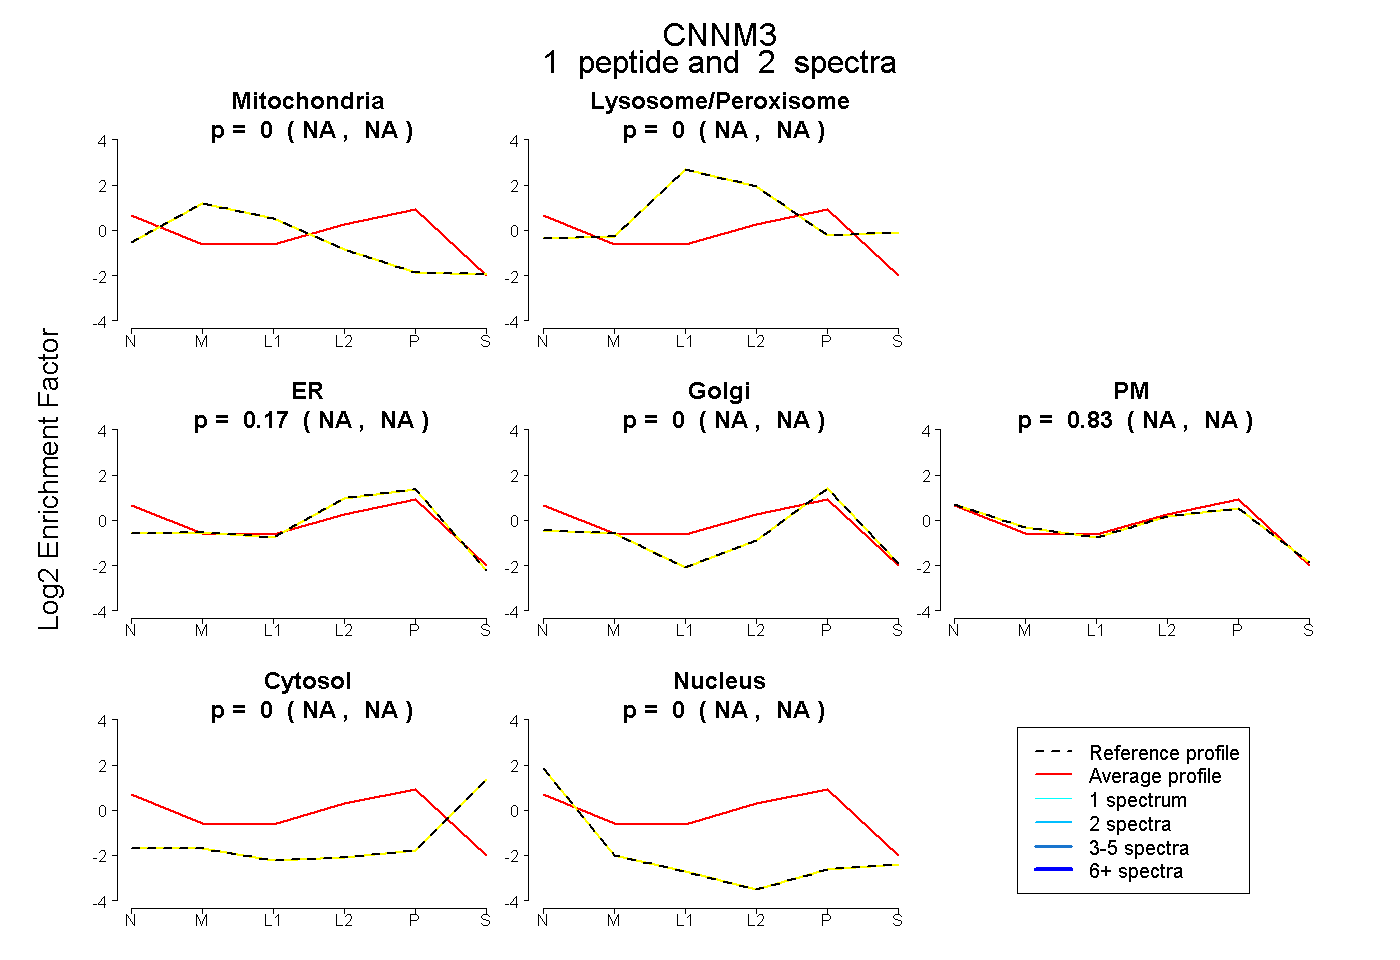
NA | NA
NA | NA
NA | NA
NA | NA
NA | NA
NA | NA
NA | NA
11peptides
spectra
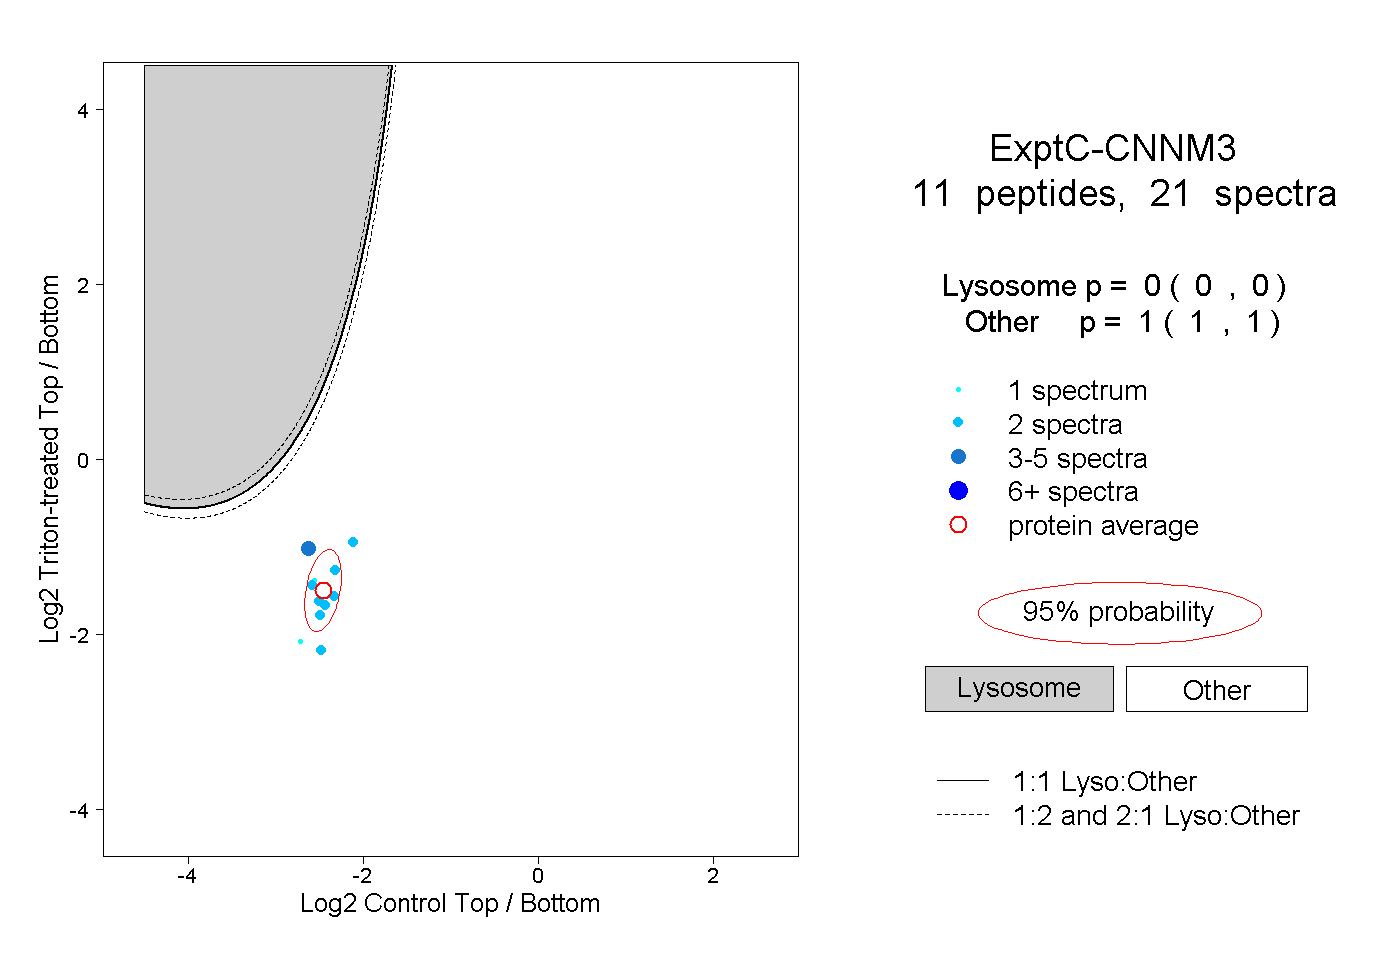
0.000 | 0.000
1.000 | 1.000
1peptide
spectra
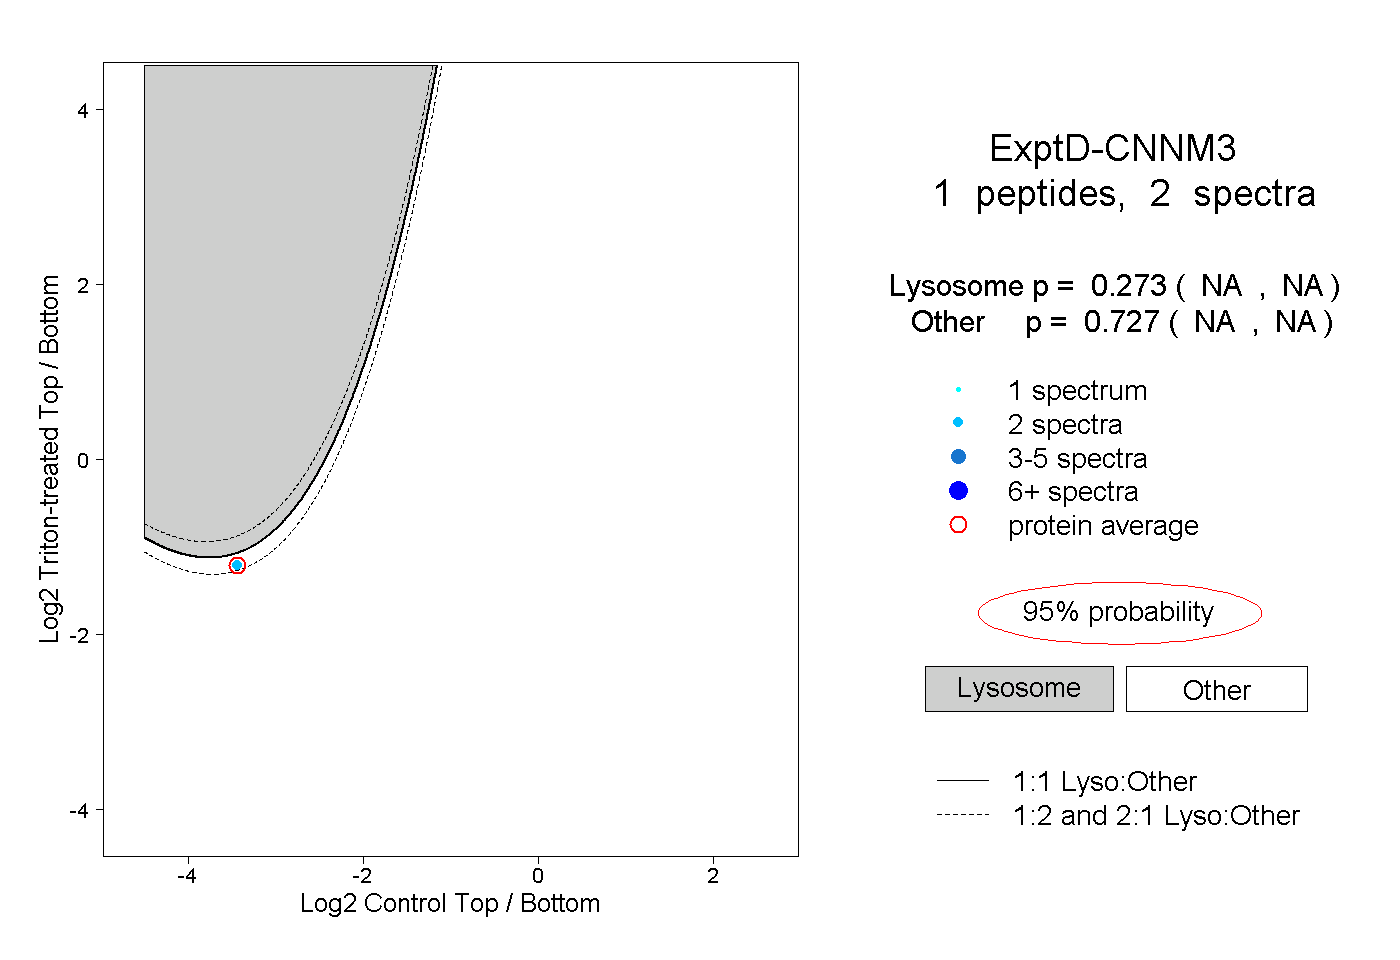
NA | NA
NA | NA