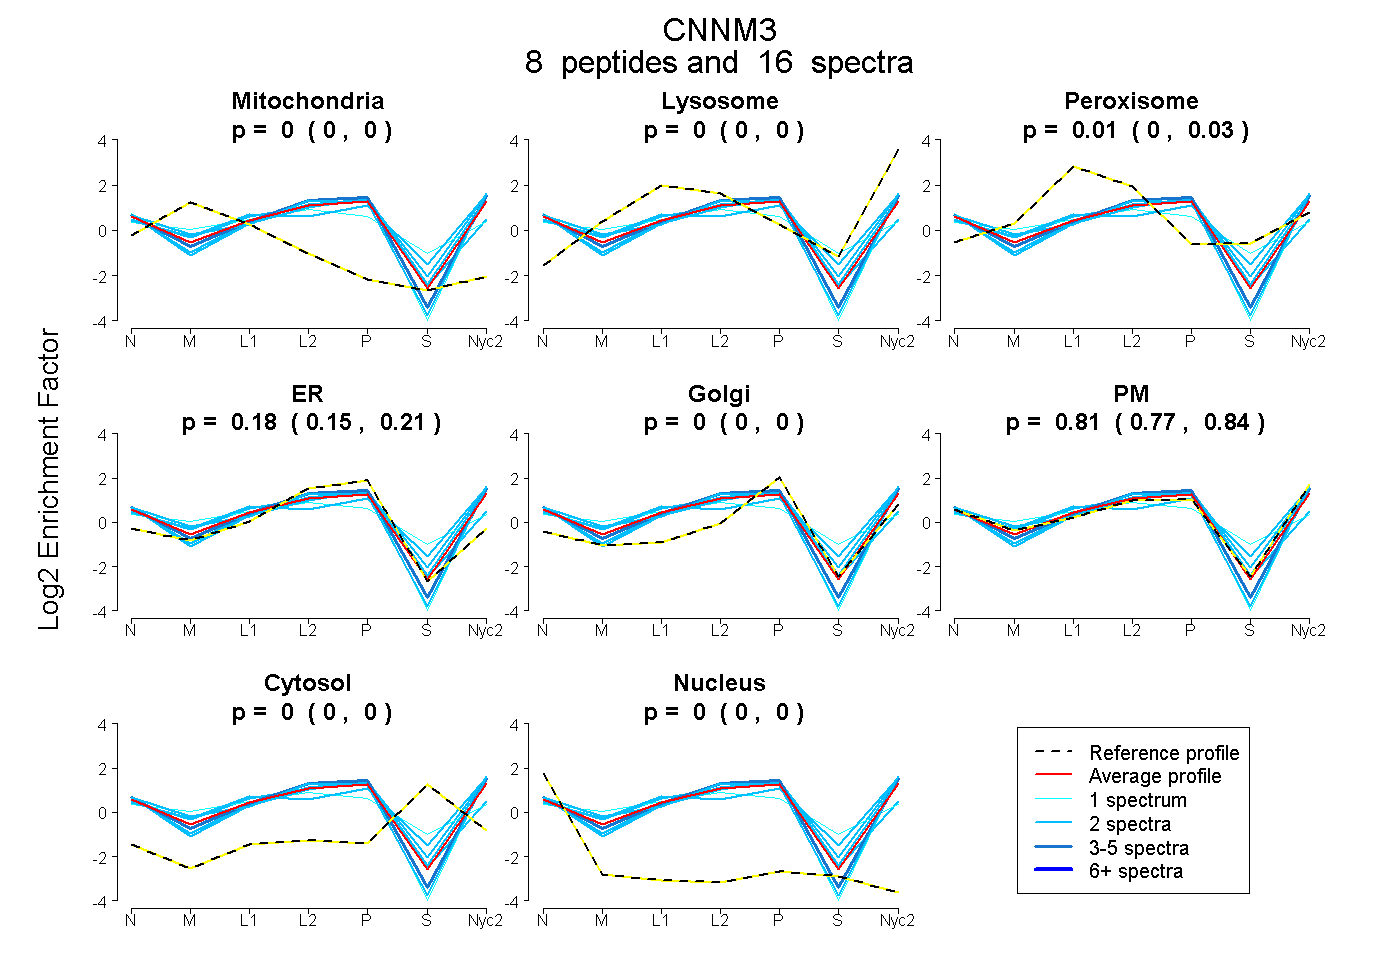
 8
8peptides
spectra
0.000 | 0.000
0.000 | 0.000
0.000 | 0.034
0.147 | 0.207
0.000 | 0.000
0.770 | 0.835
0.000 | 0.000
0.000 | 0.002
| Plot | Mito | Lyso | Perox | ER | Golgi | PM | Cytosol | Nucleus | |||||
| Expt A |
8 peptides |
16 spectra |
|
0.000 0.000 | 0.000 |
0.000 0.000 | 0.000 |
0.015 0.000 | 0.034 |
0.180 0.147 | 0.207 |
0.000 0.000 | 0.000 |
0.806 0.770 | 0.835 |
0.000 0.000 | 0.000 |
0.000 0.000 | 0.002 |
| 1 spectrum, GGGDPYSDLSK | 0.061 | 0.000 | 0.257 | 0.167 | 0.000 | 0.392 | 0.123 | 0.000 | ||
| 2 spectra, EVDVFSPLR | 0.000 | 0.000 | 0.015 | 0.098 | 0.000 | 0.864 | 0.023 | 0.000 | ||
| 1 spectrum, ISPQLLLATQR | 0.000 | 0.000 | 0.000 | 0.160 | 0.000 | 0.840 | 0.000 | 0.000 | ||
| 2 spectra, WALALAPR | 0.000 | 0.000 | 0.000 | 0.097 | 0.000 | 0.903 | 0.000 | 0.000 | ||
| 4 spectra, VLLHLLK | 0.000 | 0.000 | 0.000 | 0.180 | 0.000 | 0.820 | 0.000 | 0.000 | ||
| 2 spectra, AAPEATLCLR | 0.052 | 0.000 | 0.066 | 0.415 | 0.000 | 0.467 | 0.000 | 0.000 | ||
| 2 spectra, LATHHYLYQR | 0.000 | 0.048 | 0.149 | 0.000 | 0.092 | 0.664 | 0.047 | 0.000 | ||
| 2 spectra, SCTYCPDYTVR | 0.000 | 0.000 | 0.000 | 0.124 | 0.067 | 0.808 | 0.000 | 0.000 |
| Plot | Mito | Lyso or Perox | ER | Golgi | PM | Cytosol | Nucleus | ||||||
| Expt B |
1 peptide |
2 spectra |
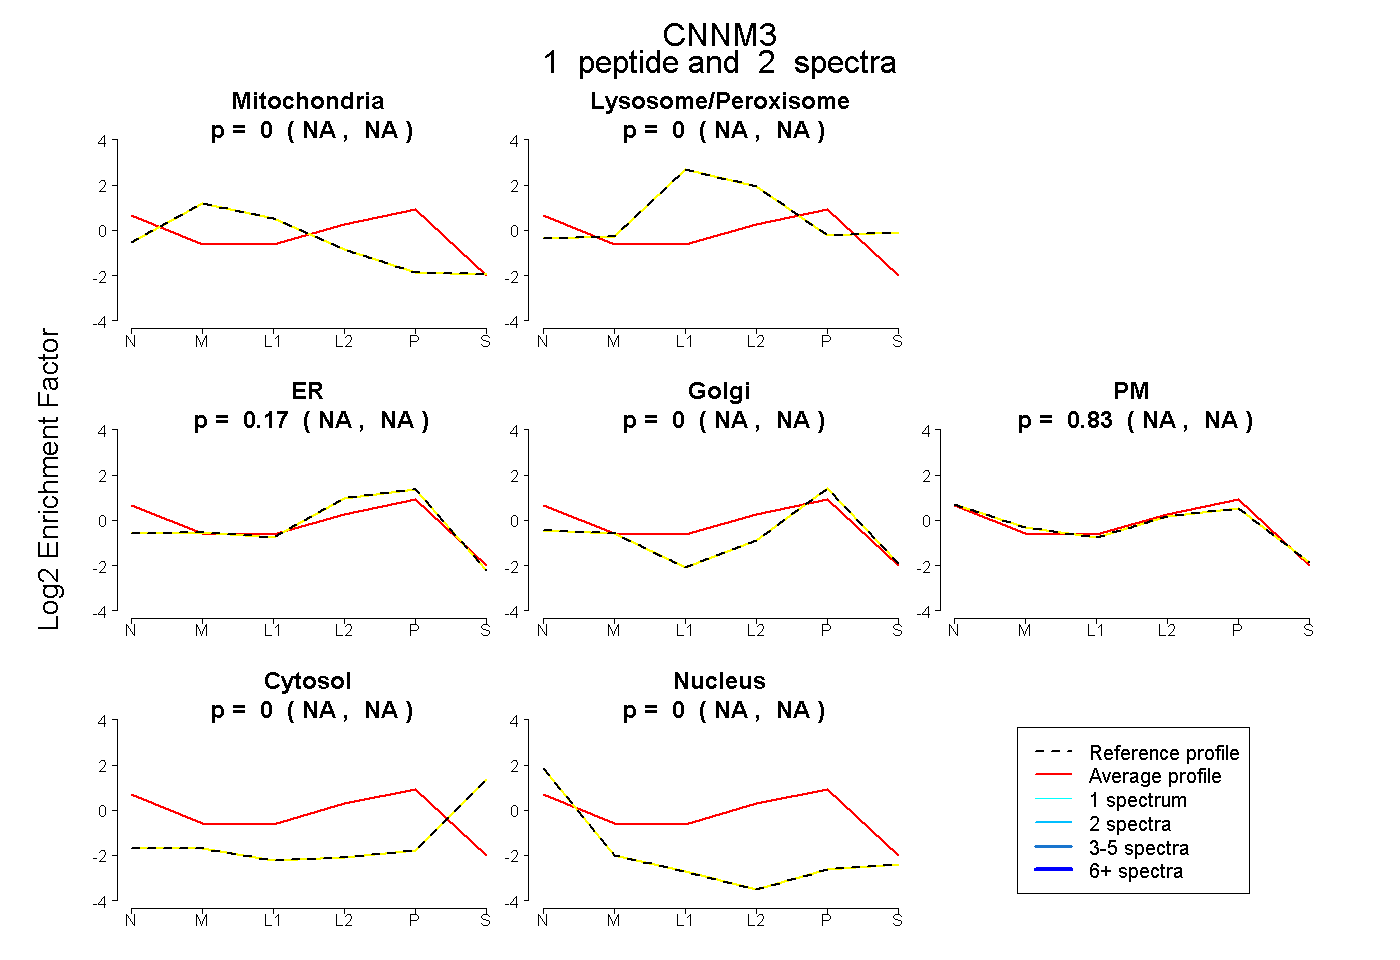 |
0.000 NA | NA |
0.002 NA | NA |
0.170 NA | NA |
0.000 NA | NA |
0.828 NA | NA |
0.000 NA | NA |
0.000 NA | NA |
|||
| Plot | Lyso | Other | |||||||||||
| Expt C |
11 peptides |
21 spectra |
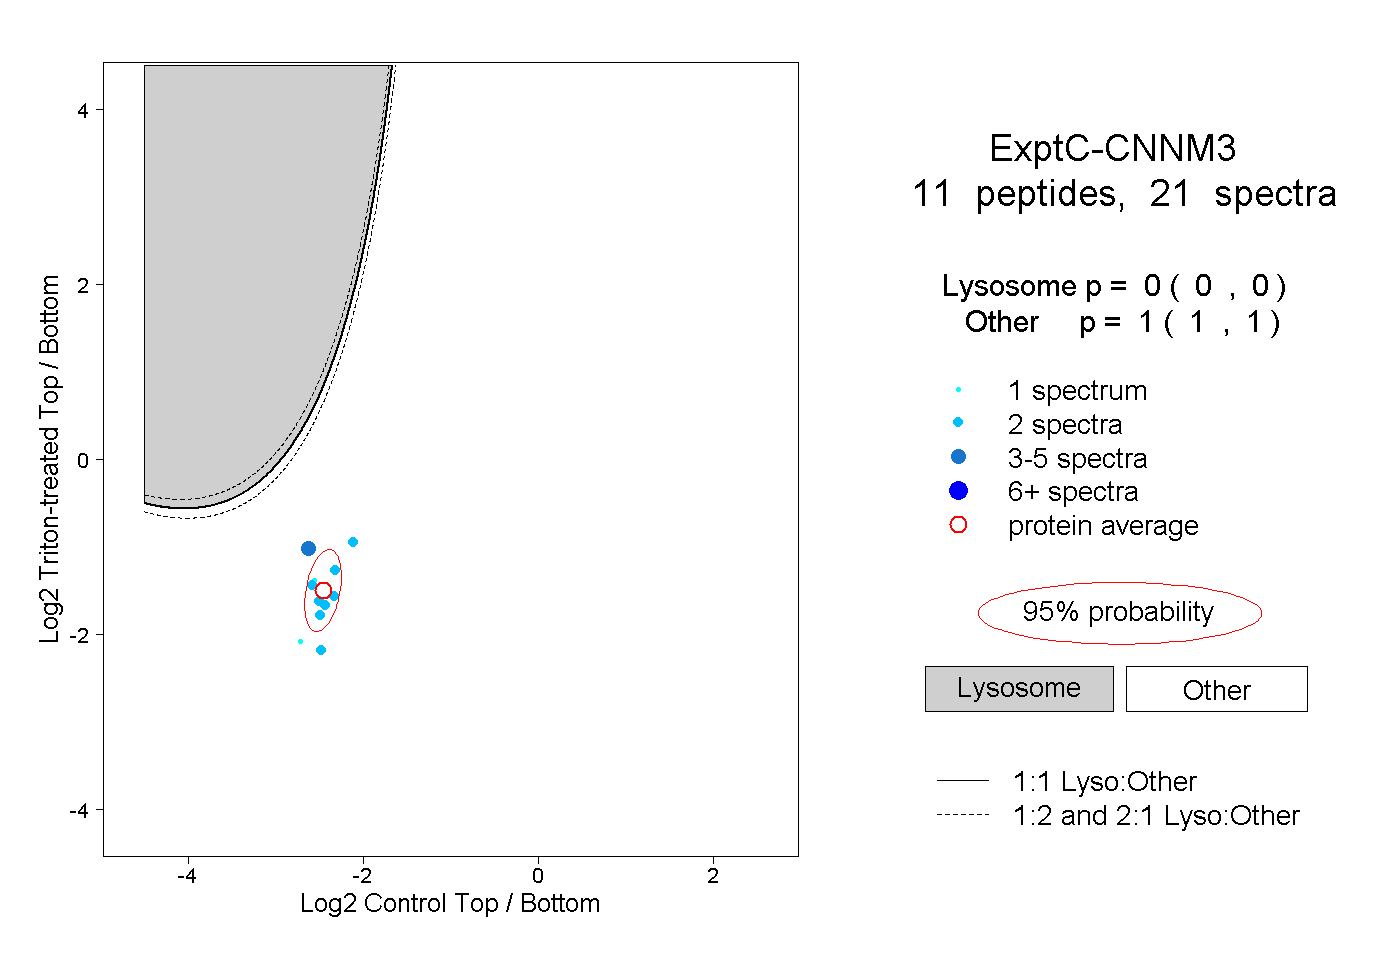 |
0.000 0.000 | 0.000 |
1.000 1.000 | 1.000 |
||||||||
| Plot | Lyso | Other | |||||||||||
| Expt D |
1 peptide |
2 spectra |
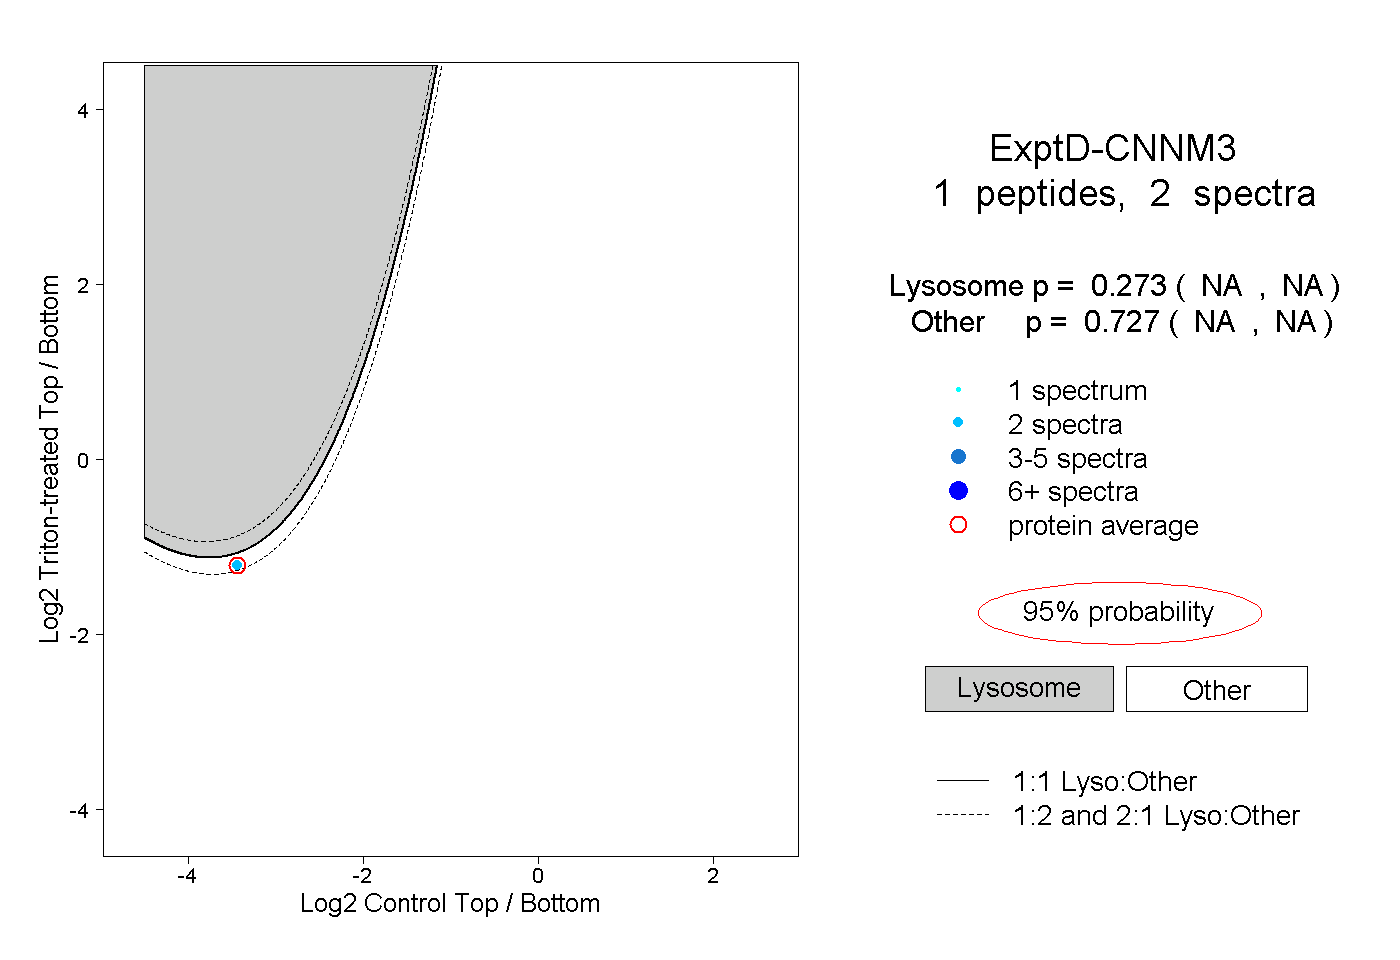 |
0.273 NA | NA |
0.727 NA | NA |