 10
10peptides
spectra
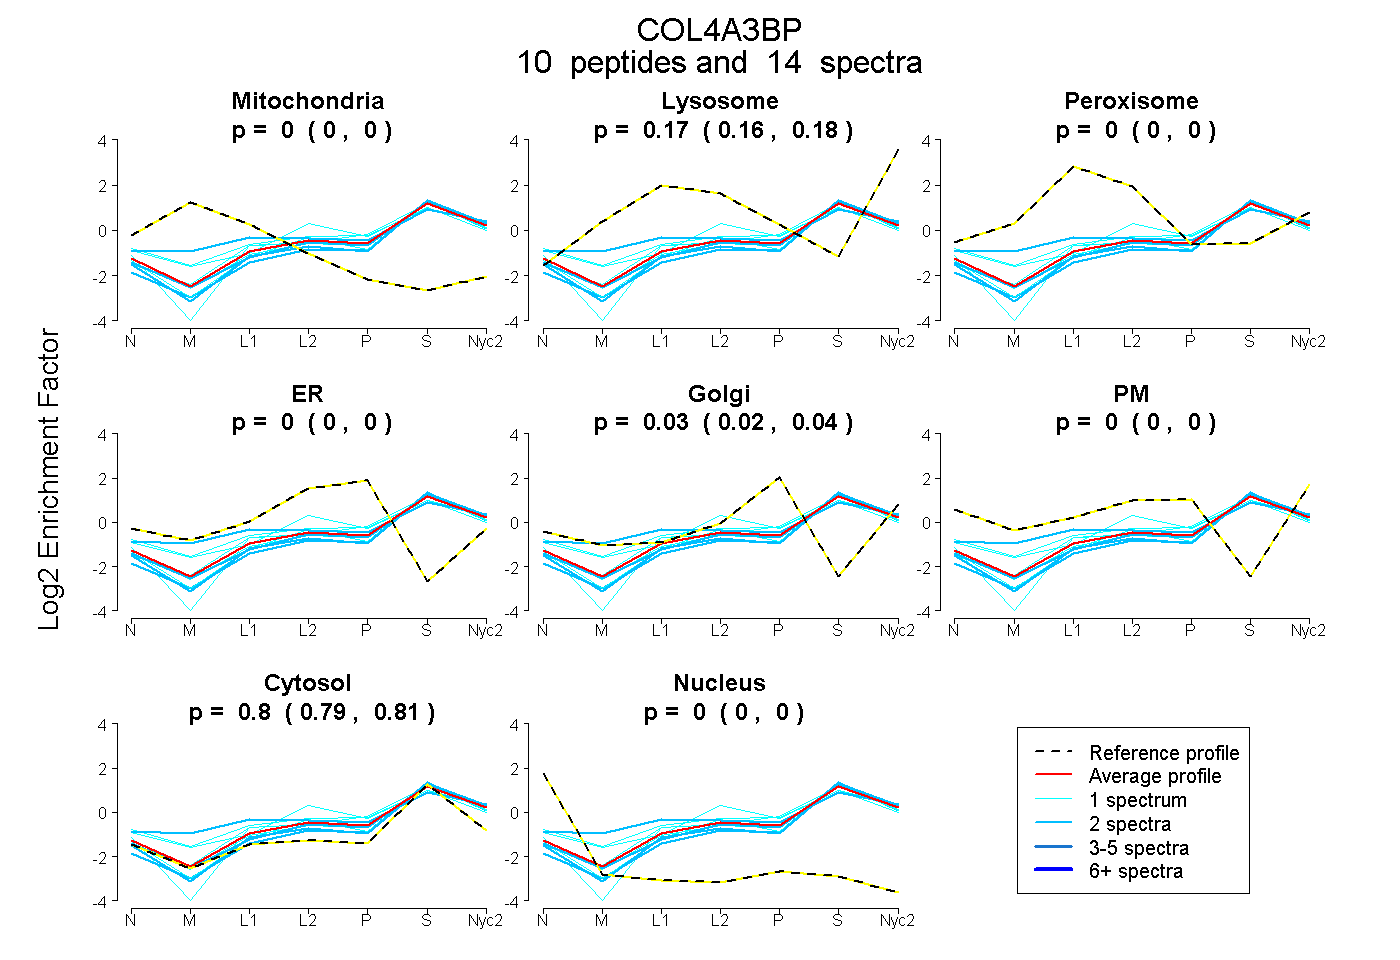
0.000 | 0.000
0.156 | 0.178
0.000 | 0.000
0.000 | 0.000
0.021 | 0.042
0.000 | 0.000
0.790 | 0.807
0.000 | 0.000
4peptides
spectra
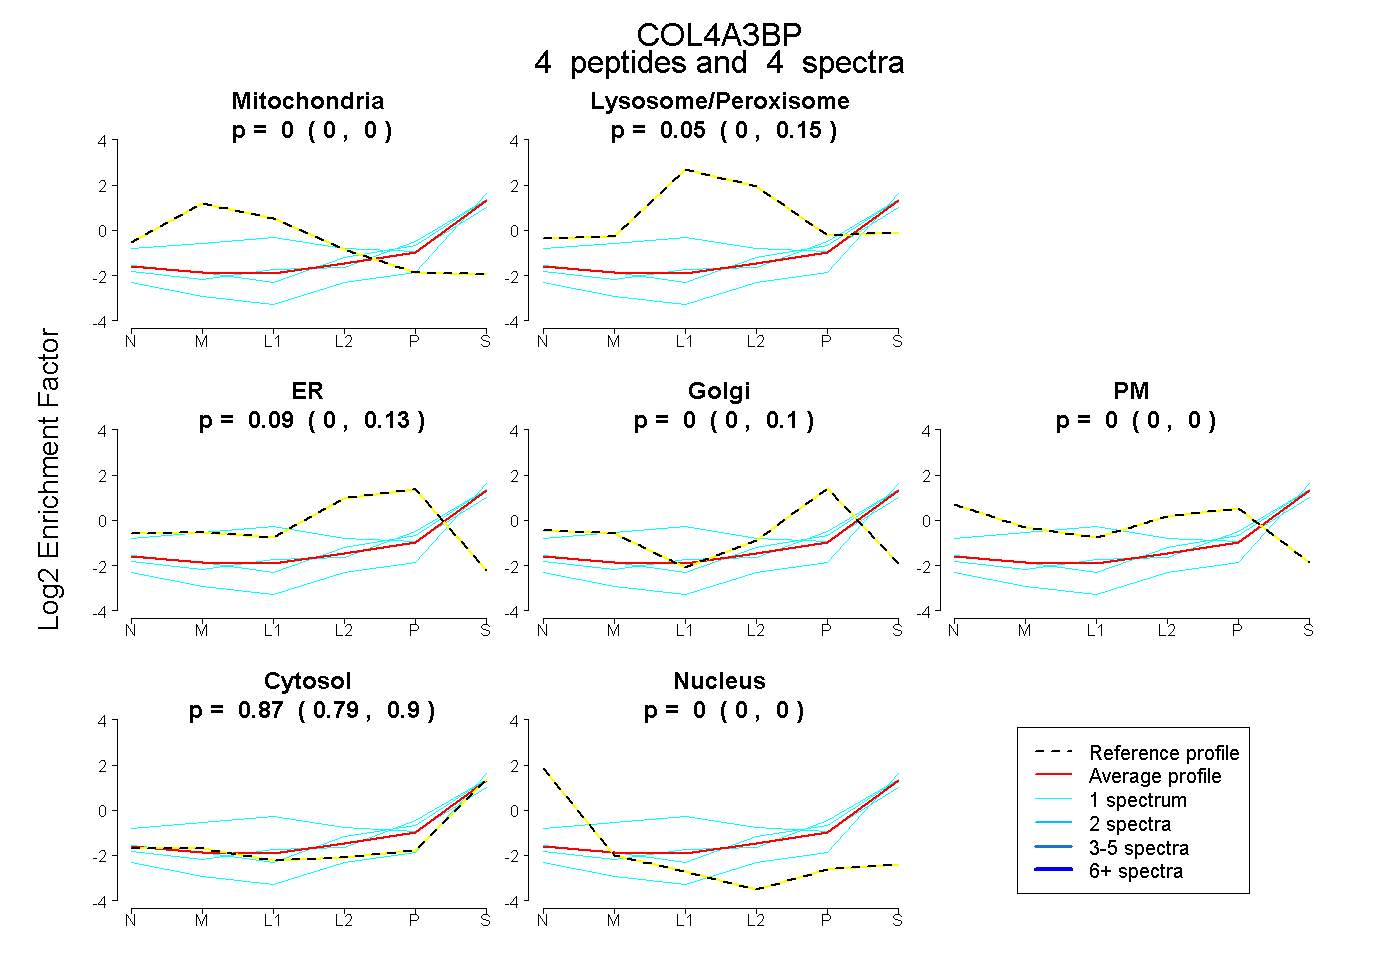
0.000 | 0.000
0.000 | 0.146
0.000 | 0.130
0.000 | 0.101
0.000 | 0.000
0.794 | 0.905
0.000 | 0.000
7peptides
spectra
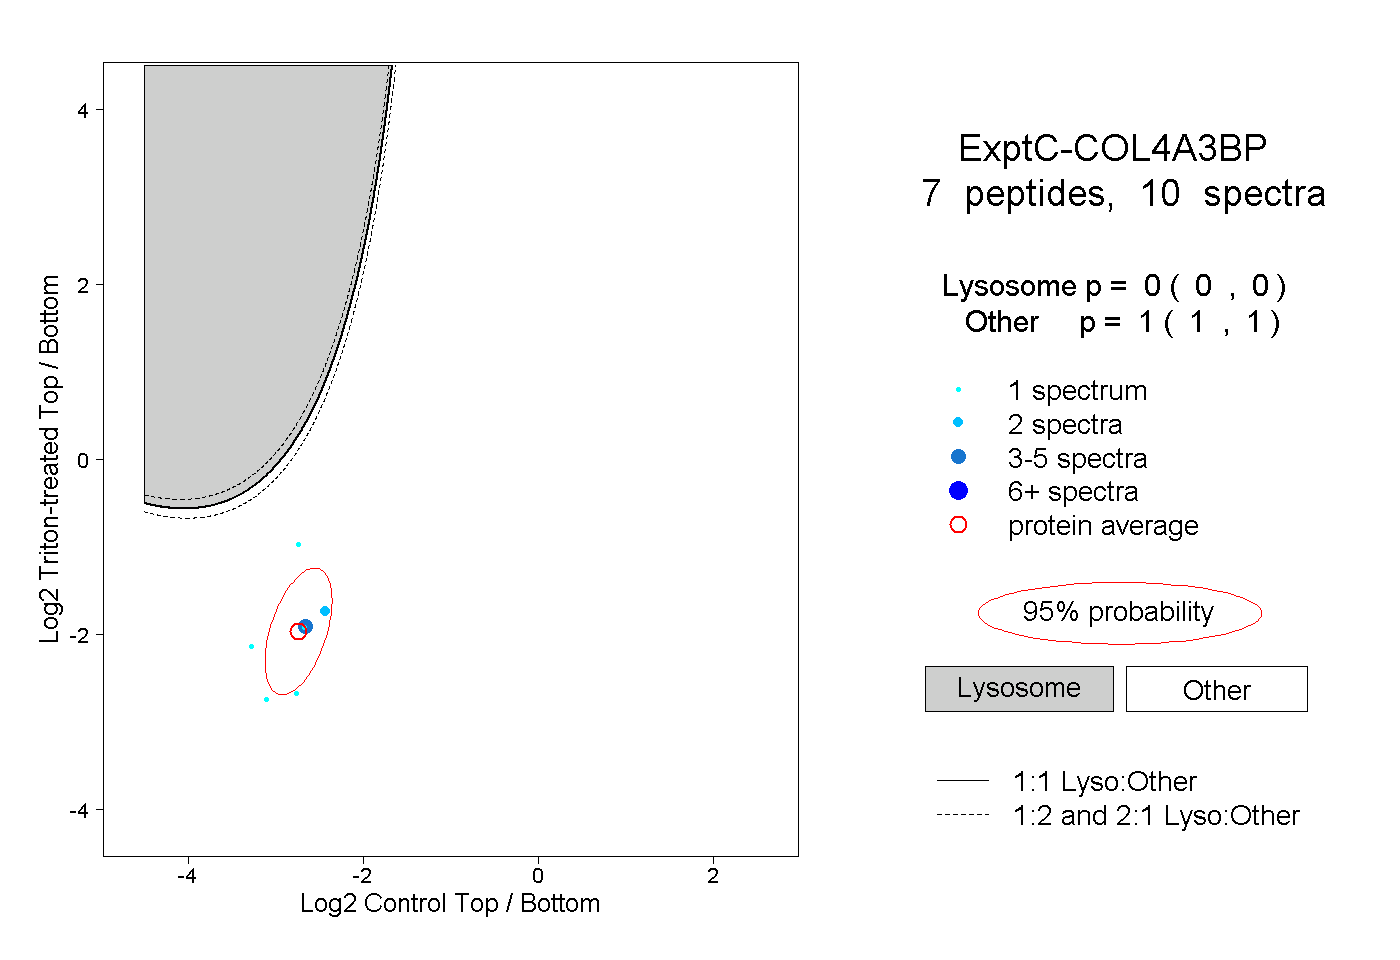
0.000 | 0.000
1.000 | 1.000