 10
10peptides
spectra
0.000 | 0.000
0.156 | 0.178
0.000 | 0.000
0.000 | 0.000
0.021 | 0.042
0.000 | 0.000
0.790 | 0.807
0.000 | 0.000
| Plot | Mito | Lyso | Perox | ER | Golgi | PM | Cytosol | Nucleus | |||||
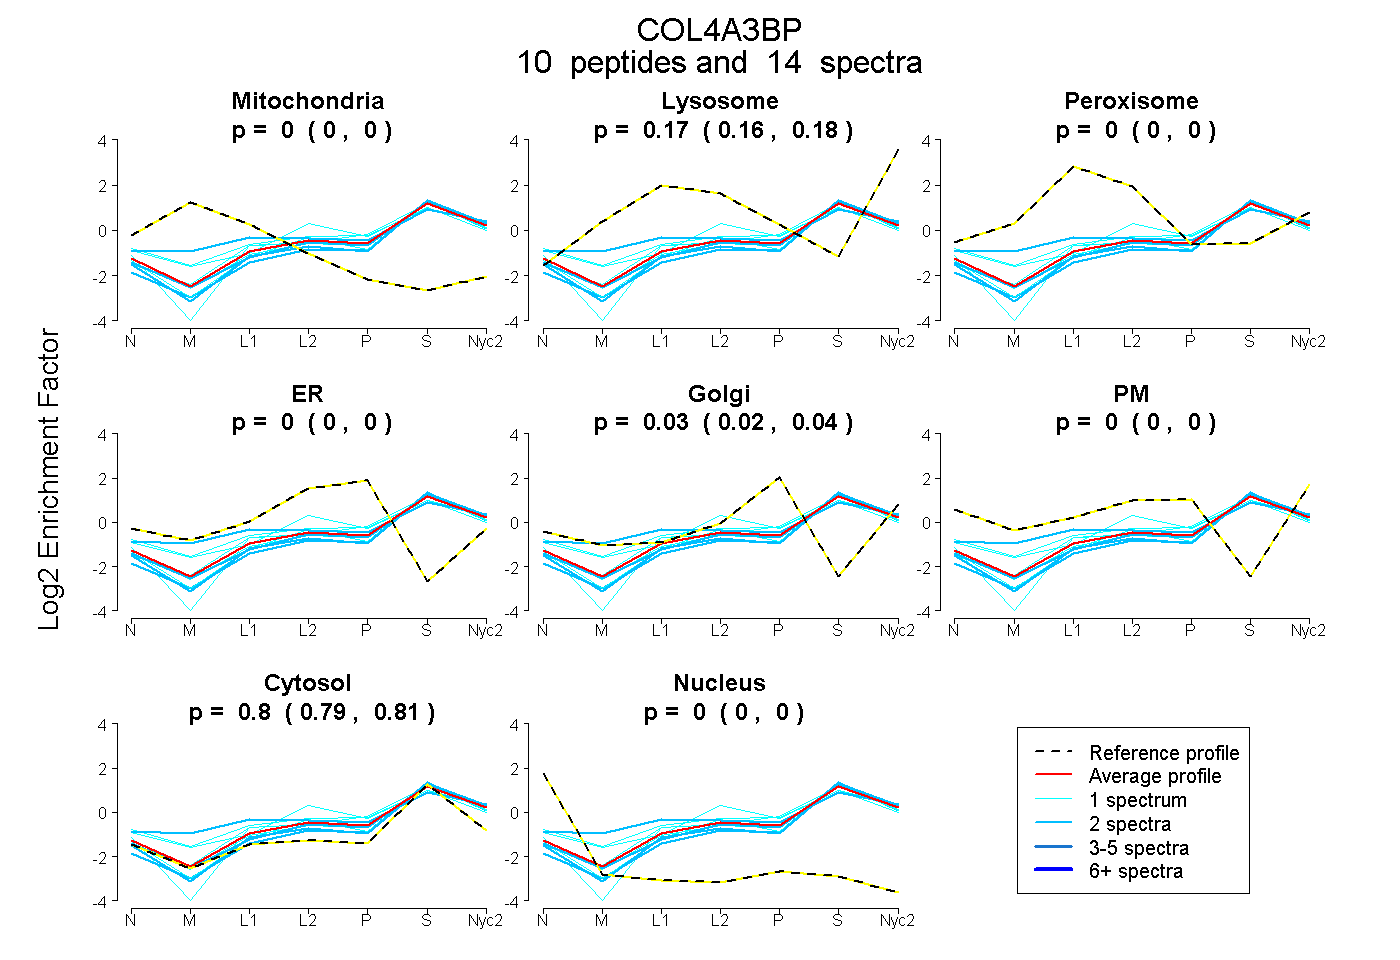
| Expt A |
10 peptides |
14 spectra |
|
0.000 0.000 | 0.000 |
0.168 0.156 | 0.178 |
0.000 0.000 | 0.000 |
0.000 0.000 | 0.000 |
0.033 0.021 | 0.042 |
0.000 0.000 | 0.000 |
0.799 0.790 | 0.807 |
0.000 0.000 | 0.000 |
| 1 spectrum, LFPHVTPK | 0.000 | 0.167 | 0.000 | 0.000 | 0.066 | 0.000 | 0.768 | 0.000 | ||
| 1 spectrum, ATHAVK | 0.000 | 0.129 | 0.040 | 0.162 | 0.000 | 0.000 | 0.669 | 0.000 | ||
| 1 spectrum, QQWVDAIEQHK | 0.000 | 0.127 | 0.000 | 0.007 | 0.000 | 0.000 | 0.867 | 0.000 | ||
| 1 spectrum, EVEENGIVLDPLK | 0.000 | 0.115 | 0.000 | 0.000 | 0.011 | 0.000 | 0.874 | 0.000 | ||
| 2 spectra, QVDTLQK | 0.000 | 0.176 | 0.125 | 0.000 | 0.000 | 0.076 | 0.623 | 0.000 | ||
| 2 spectra, LAEMETFR | 0.000 | 0.084 | 0.000 | 0.000 | 0.000 | 0.000 | 0.916 | 0.000 | ||
| 1 spectrum, GINGIDFK | 0.000 | 0.150 | 0.000 | 0.000 | 0.024 | 0.000 | 0.826 | 0.000 | ||
| 2 spectra, VWPASQR | 0.000 | 0.146 | 0.000 | 0.000 | 0.023 | 0.000 | 0.830 | 0.000 | ||
| 1 spectrum, EESWQK | 0.000 | 0.159 | 0.031 | 0.000 | 0.000 | 0.146 | 0.664 | 0.000 | ||
| 2 spectra, TESGYGSESSLR | 0.000 | 0.115 | 0.000 | 0.000 | 0.000 | 0.000 | 0.885 | 0.000 |
| Plot | Mito | Lyso or Perox | ER | Golgi | PM | Cytosol | Nucleus | ||||||
| Expt B |
4 peptides |
4 spectra |
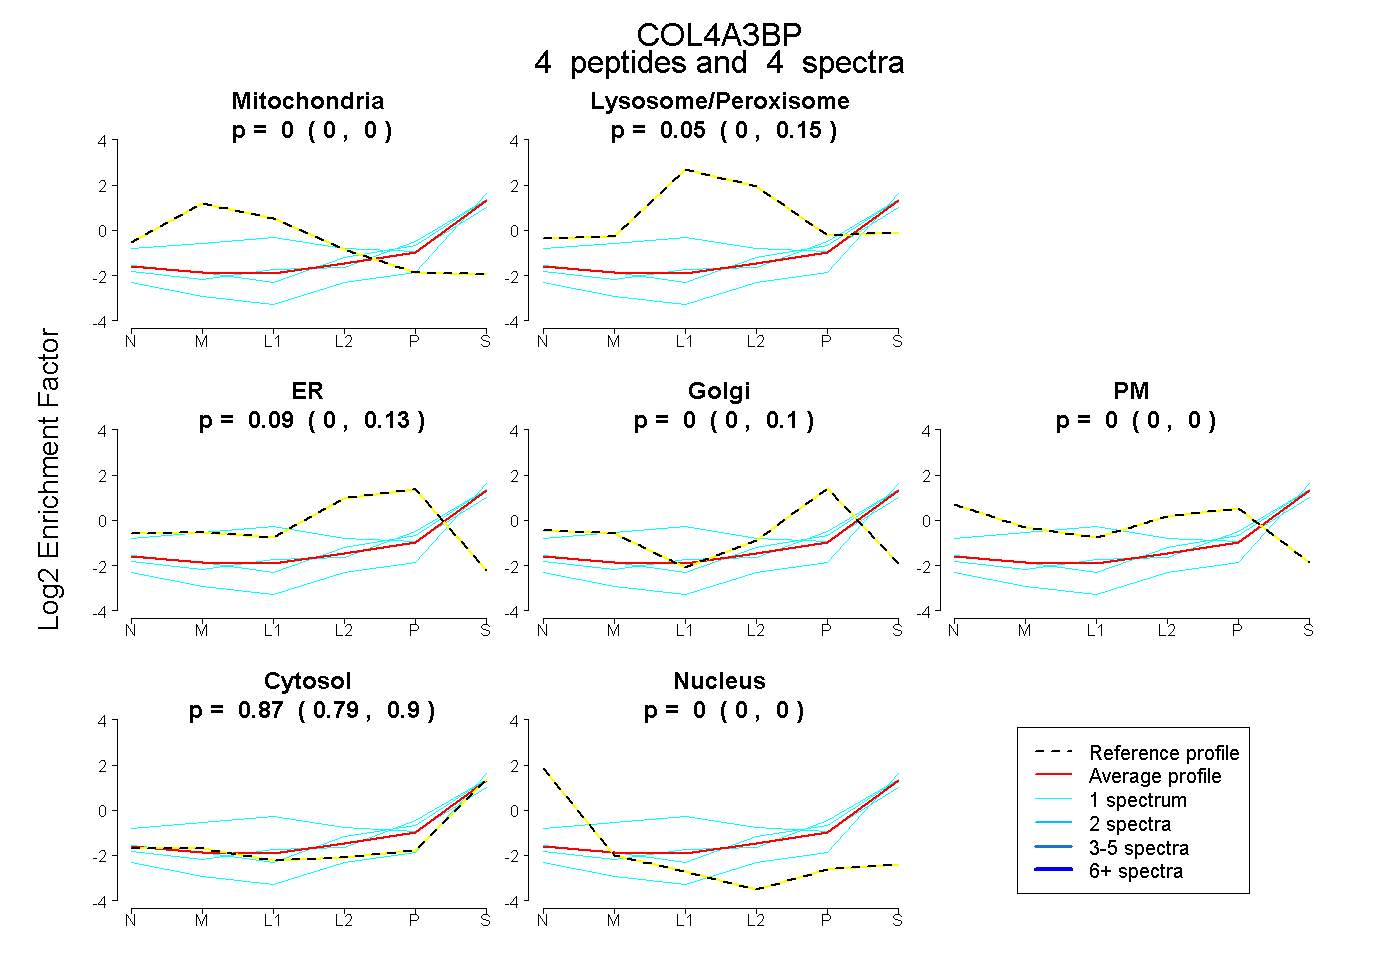 |
0.000 0.000 | 0.000 |
0.045 0.000 | 0.146 |
0.089 0.000 | 0.130 |
0.000 0.000 | 0.101 |
0.000 0.000 | 0.000 |
0.865 0.794 | 0.905 |
0.000 0.000 | 0.000 |
|||
| Plot | Lyso | Other | |||||||||||
| Expt C |
7 peptides |
10 spectra |
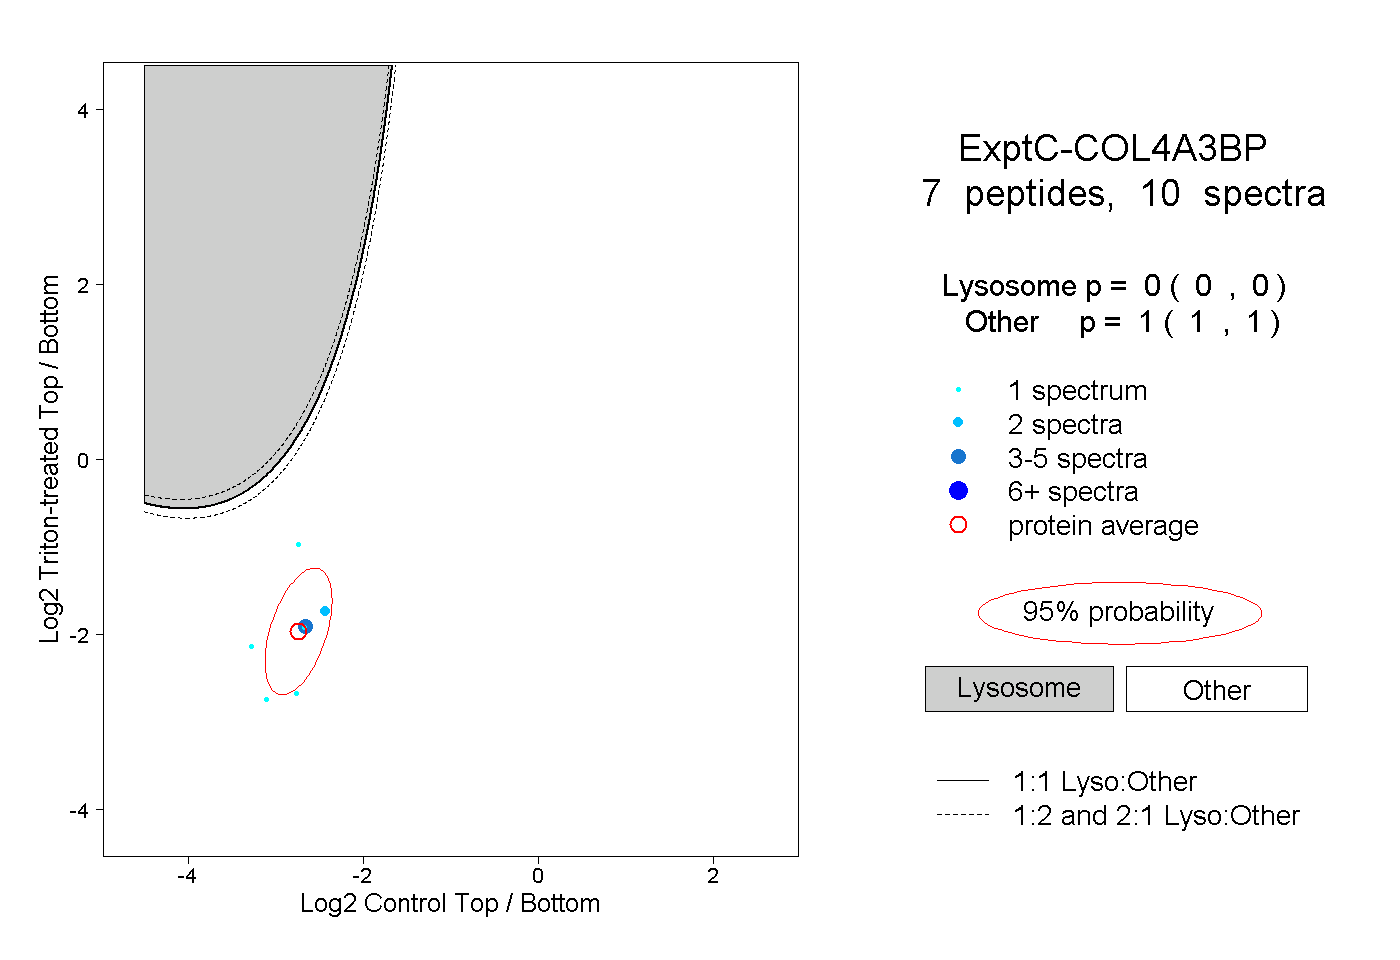 |
0.000 0.000 | 0.000 |
1.000 1.000 | 1.000 |