 5
5peptides
spectra
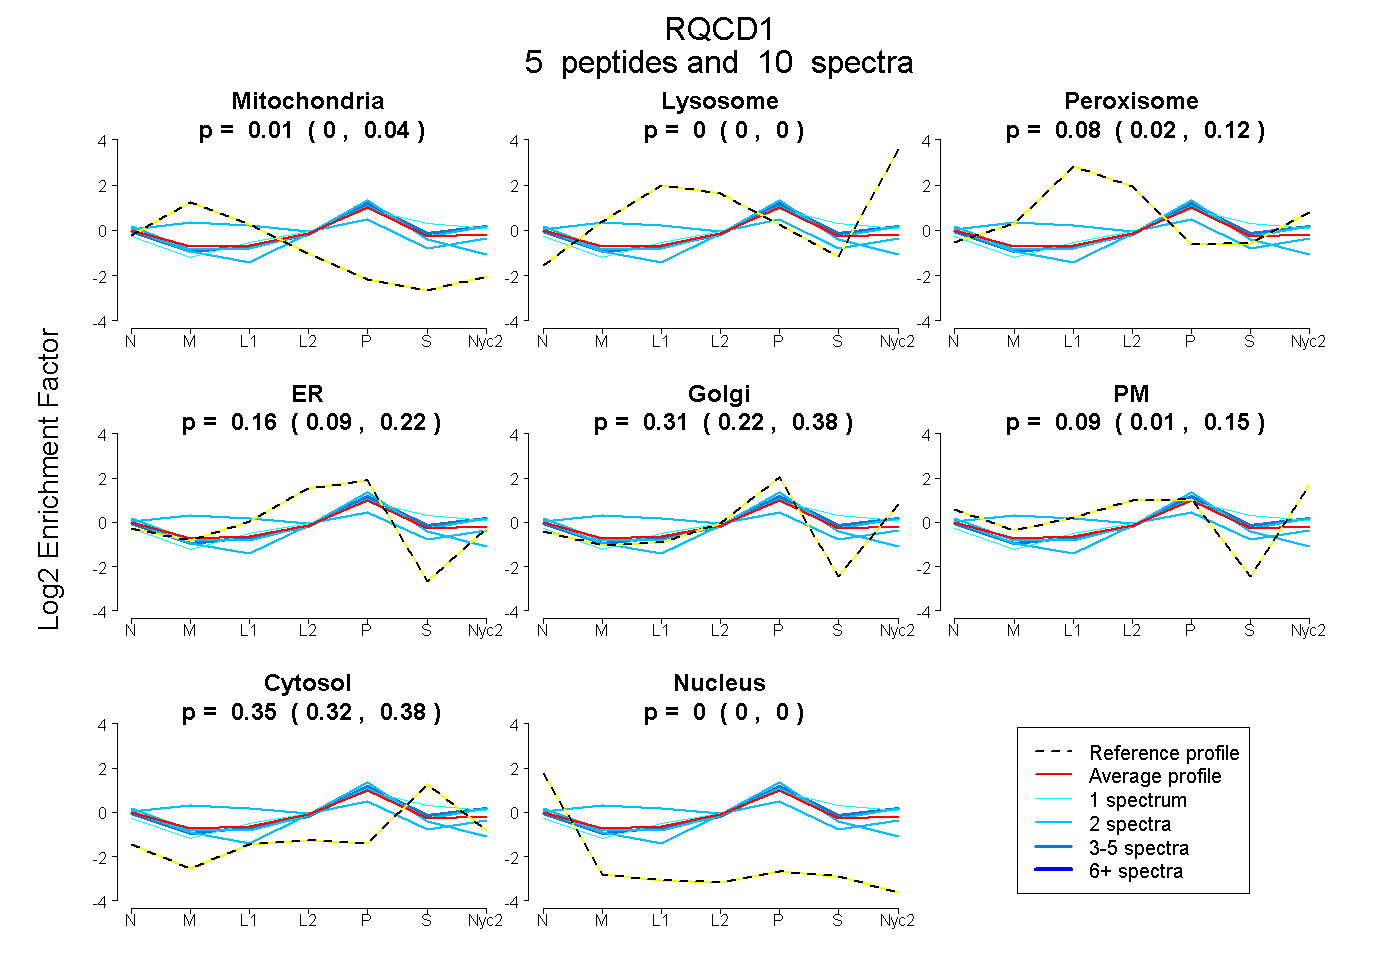
0.000 | 0.035
0.000 | 0.000
0.025 | 0.121
0.093 | 0.222
0.221 | 0.376
0.013 | 0.150
0.319 | 0.382
0.000 | 0.000
1peptide
spectrum
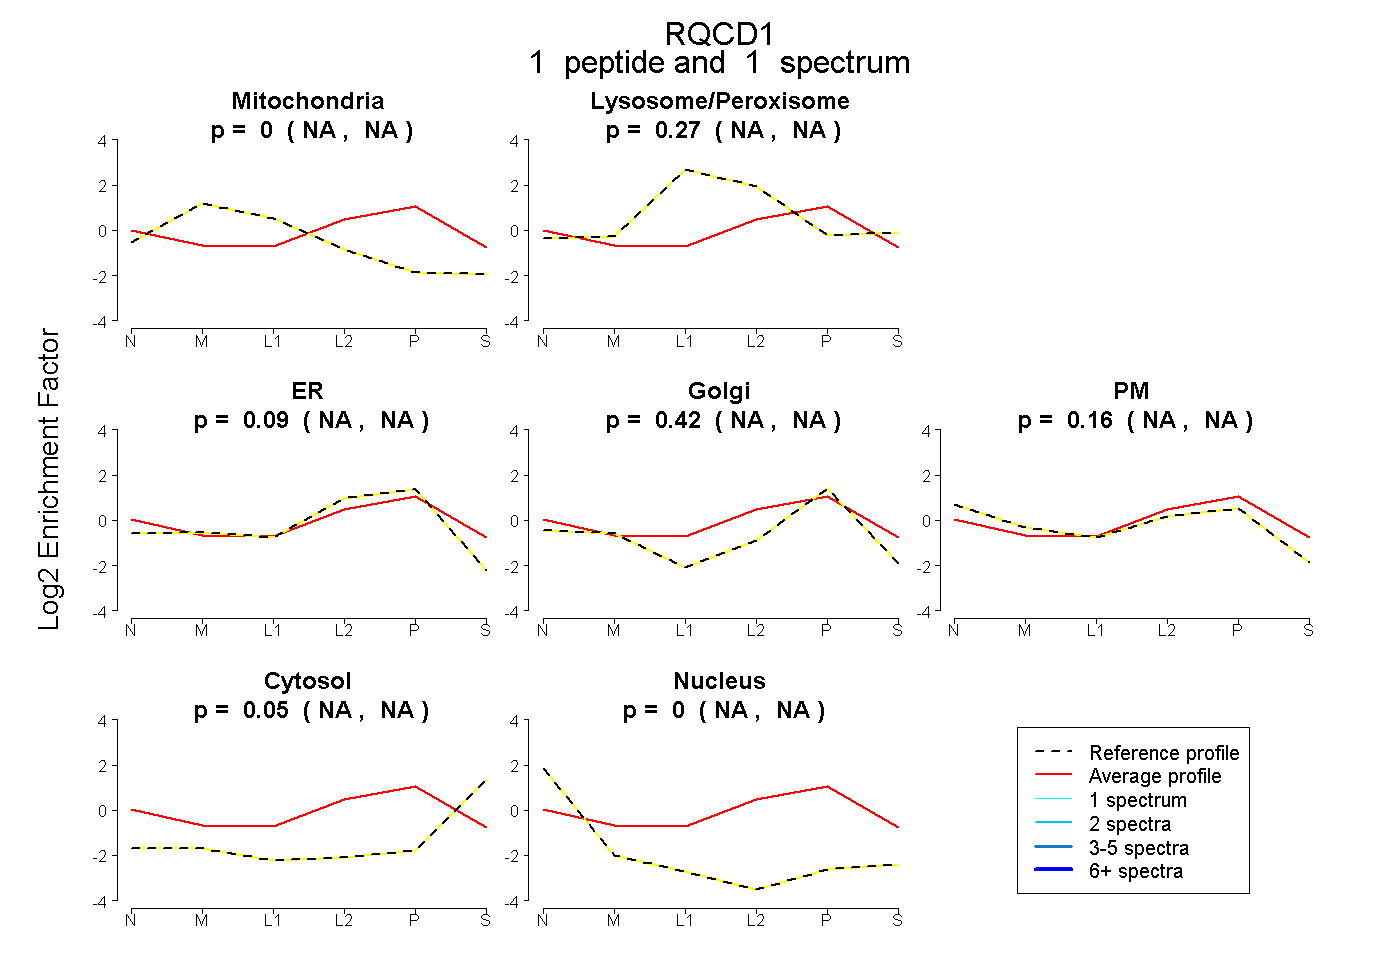
NA | NA
NA | NA
NA | NA
NA | NA
NA | NA
NA | NA
NA | NA
4peptides
spectra
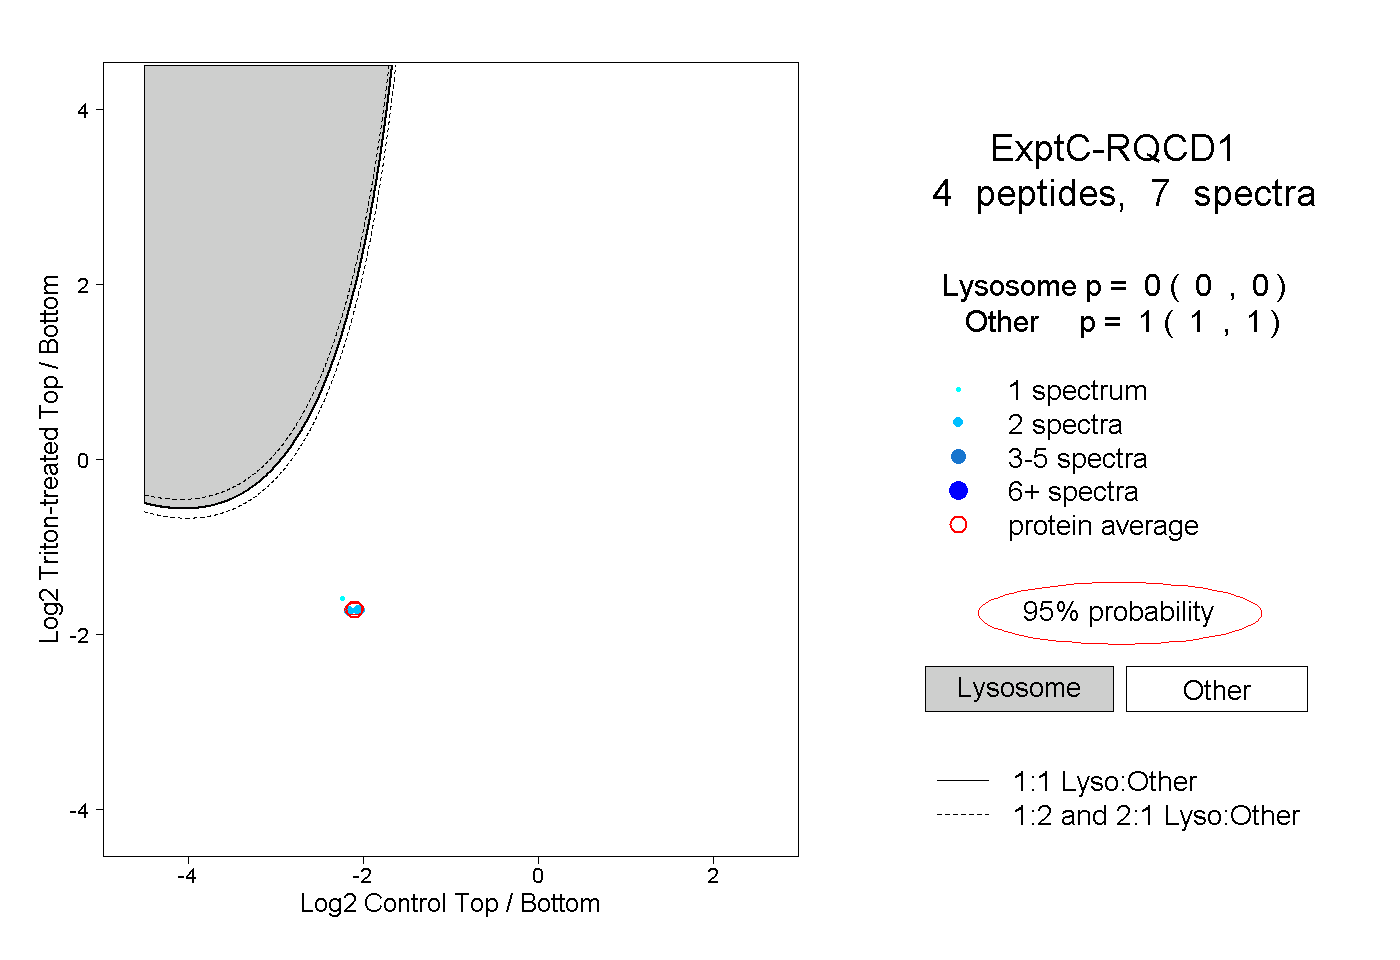
0.000 | 0.000
1.000 | 1.000
1peptide
spectrum
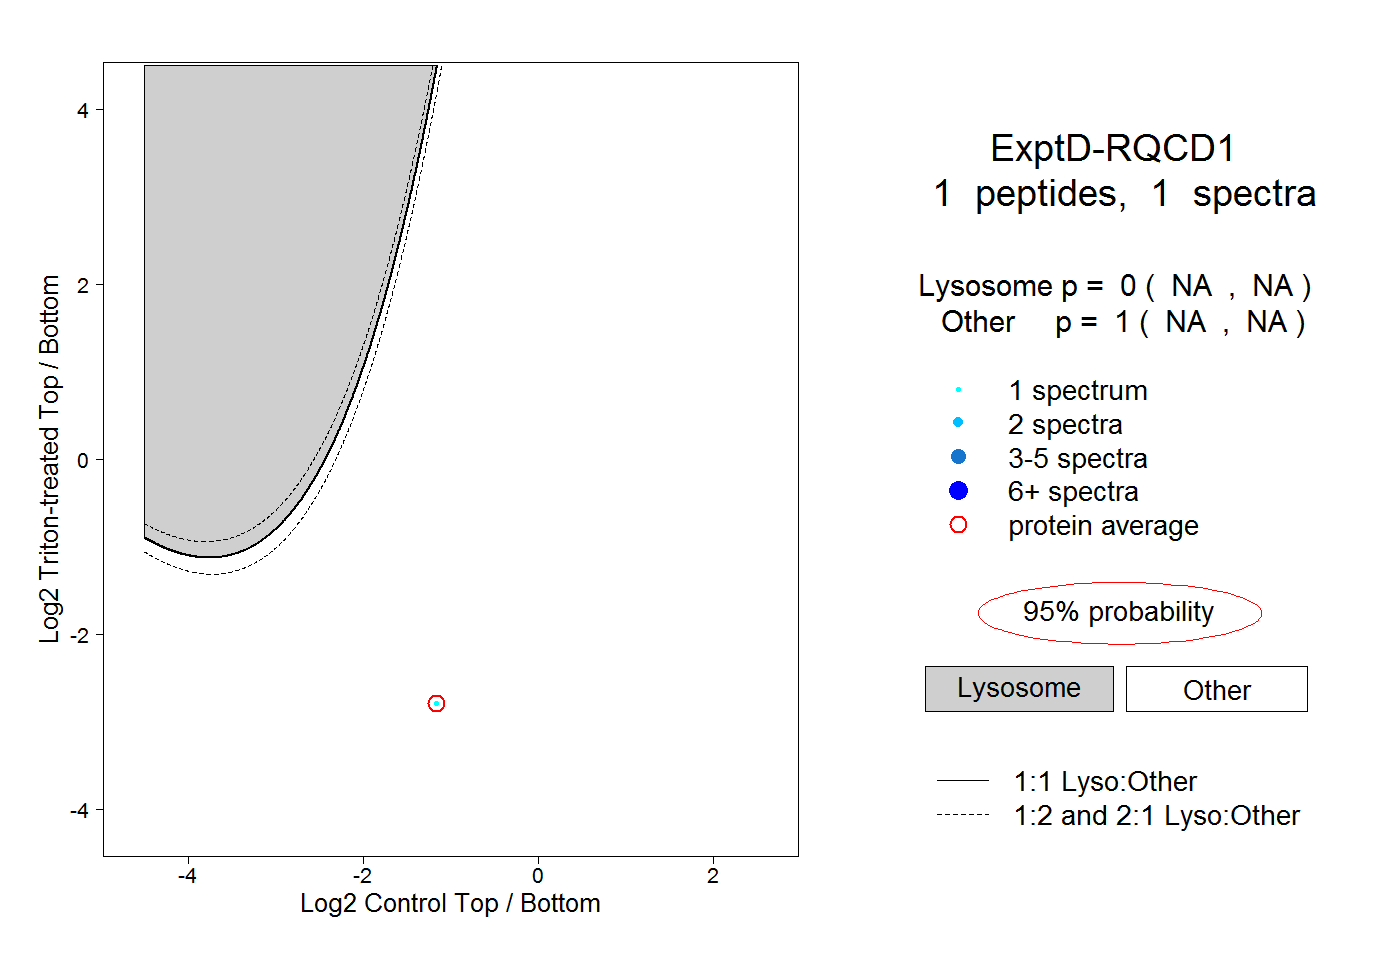
NA | NA
NA | NA