 5
5peptides
spectra
0.000 | 0.035
0.000 | 0.000
0.025 | 0.121
0.093 | 0.222
0.221 | 0.376
0.013 | 0.150
0.319 | 0.382
0.000 | 0.000
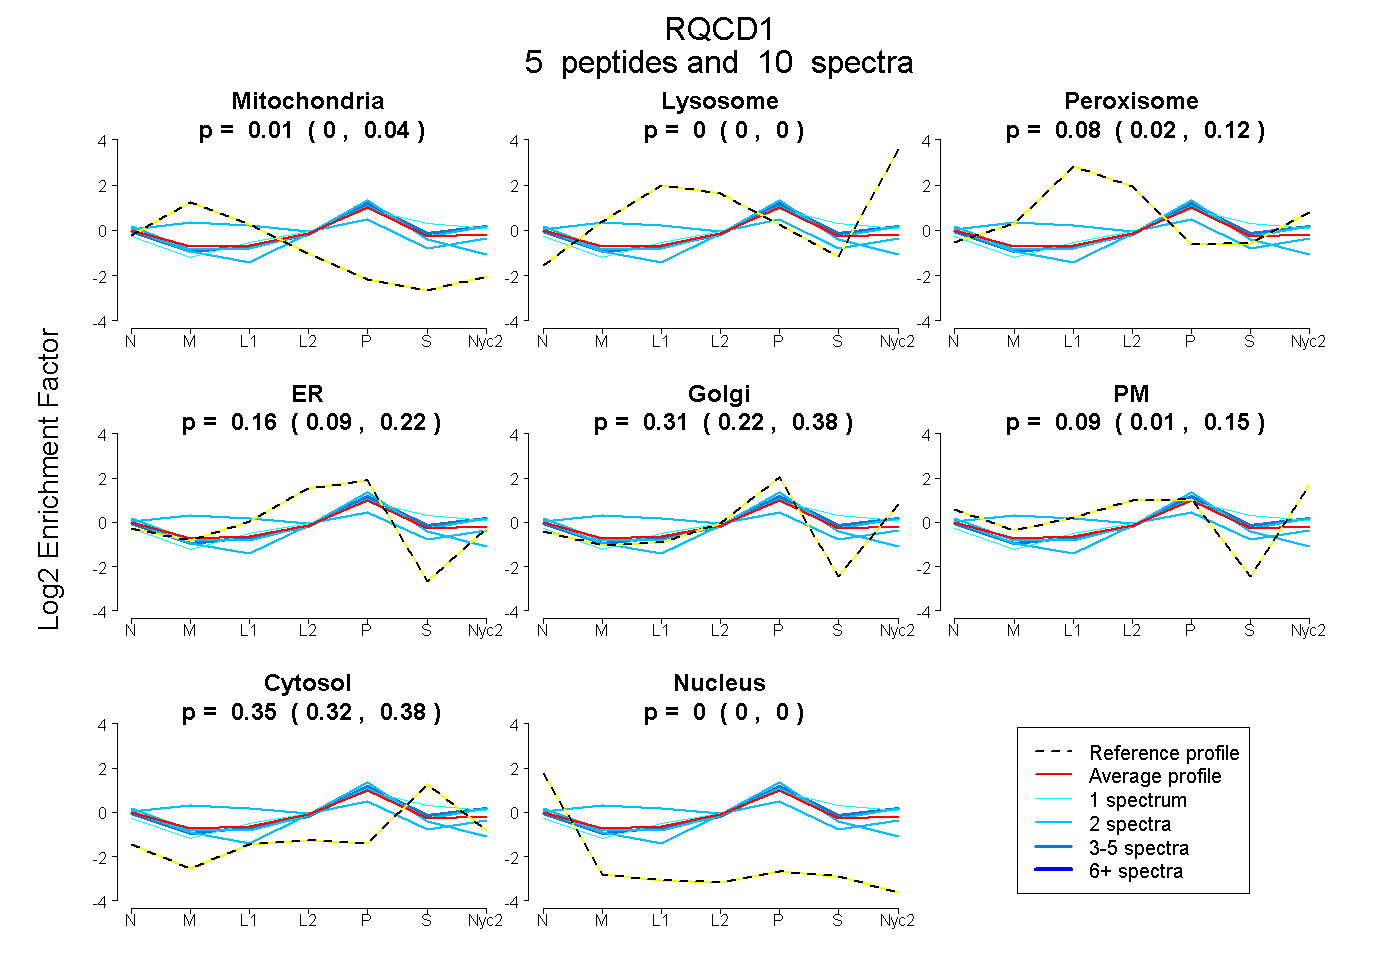
| Plot | Mito | Lyso | Perox | ER | Golgi | PM | Cytosol | Nucleus | |||||
| Expt A |
5 peptides |
10 spectra |
|
0.010 0.000 | 0.035 |
0.000 0.000 | 0.000 |
0.081 0.025 | 0.121 |
0.158 0.093 | 0.222 |
0.310 0.221 | 0.376 |
0.088 0.013 | 0.150 |
0.353 0.319 | 0.382 |
0.000 0.000 | 0.000 |
| 2 spectra, NLQEGQVTDPR | 0.000 | 0.000 | 0.000 | 0.379 | 0.207 | 0.000 | 0.351 | 0.062 | ||
| 1 spectrum, TRPFEYLR | 0.000 | 0.000 | 0.176 | 0.011 | 0.413 | 0.000 | 0.401 | 0.000 | ||
| 2 spectra, FSHVAMILGK | 0.231 | 0.000 | 0.271 | 0.000 | 0.374 | 0.000 | 0.124 | 0.000 | ||
| 2 spectra, TVATFILQK | 0.000 | 0.000 | 0.015 | 0.042 | 0.293 | 0.286 | 0.365 | 0.000 | ||
| 3 spectra, ENALLELSK | 0.000 | 0.000 | 0.102 | 0.000 | 0.482 | 0.081 | 0.335 | 0.000 |
| Plot | Mito | Lyso or Perox | ER | Golgi | PM | Cytosol | Nucleus | ||||||
| Expt B |
1 peptide |
1 spectrum |
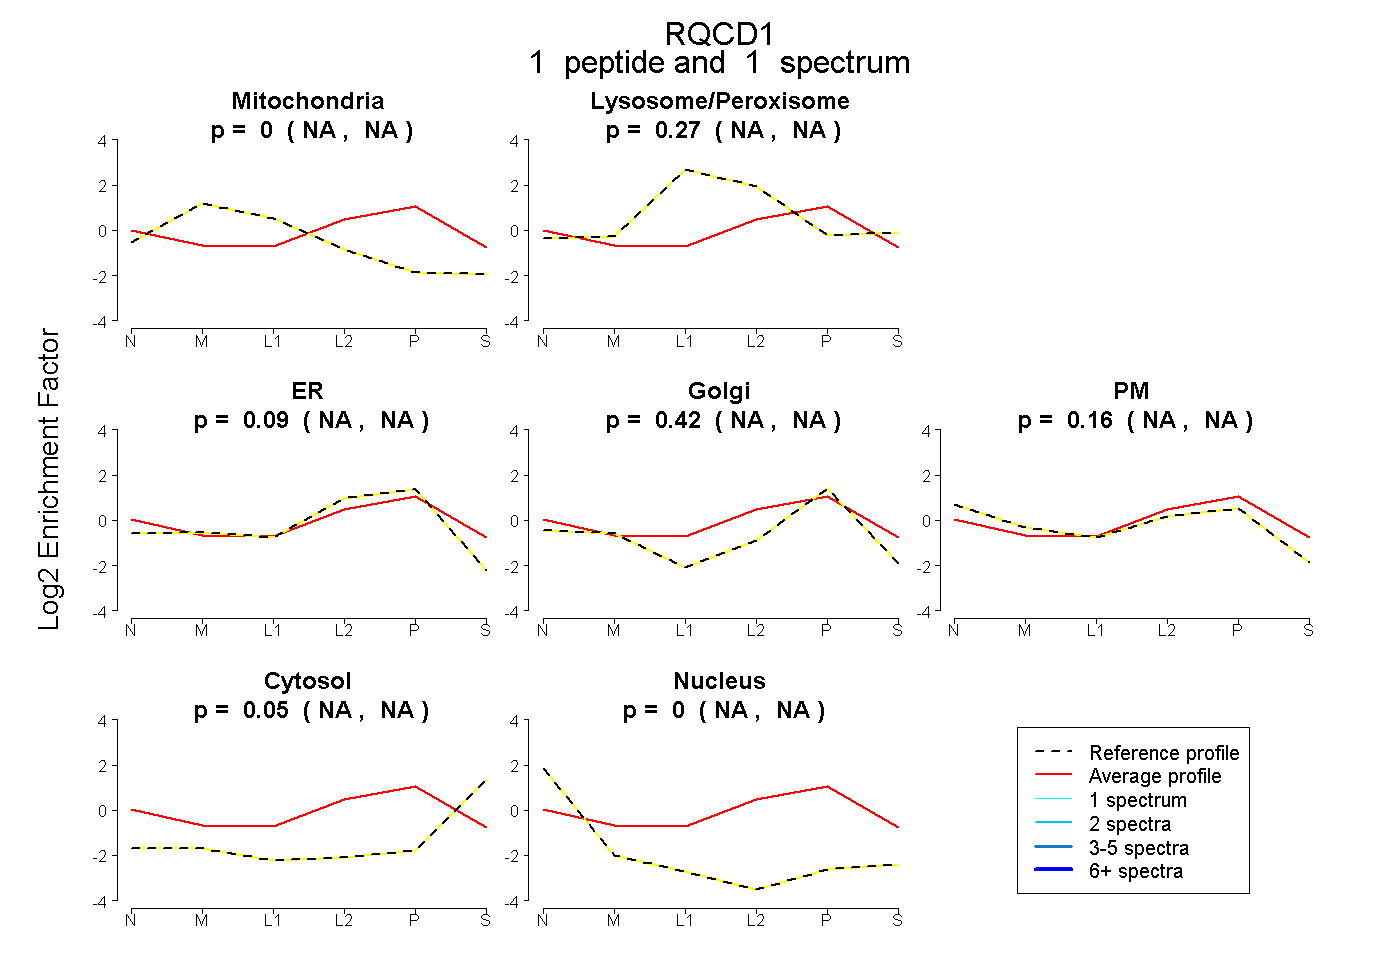 |
0.000 NA | NA |
0.271 NA | NA |
0.094 NA | NA |
0.421 NA | NA |
0.165 NA | NA |
0.049 NA | NA |
0.000 NA | NA |
|||
| Plot | Lyso | Other | |||||||||||
| Expt C |
4 peptides |
7 spectra |
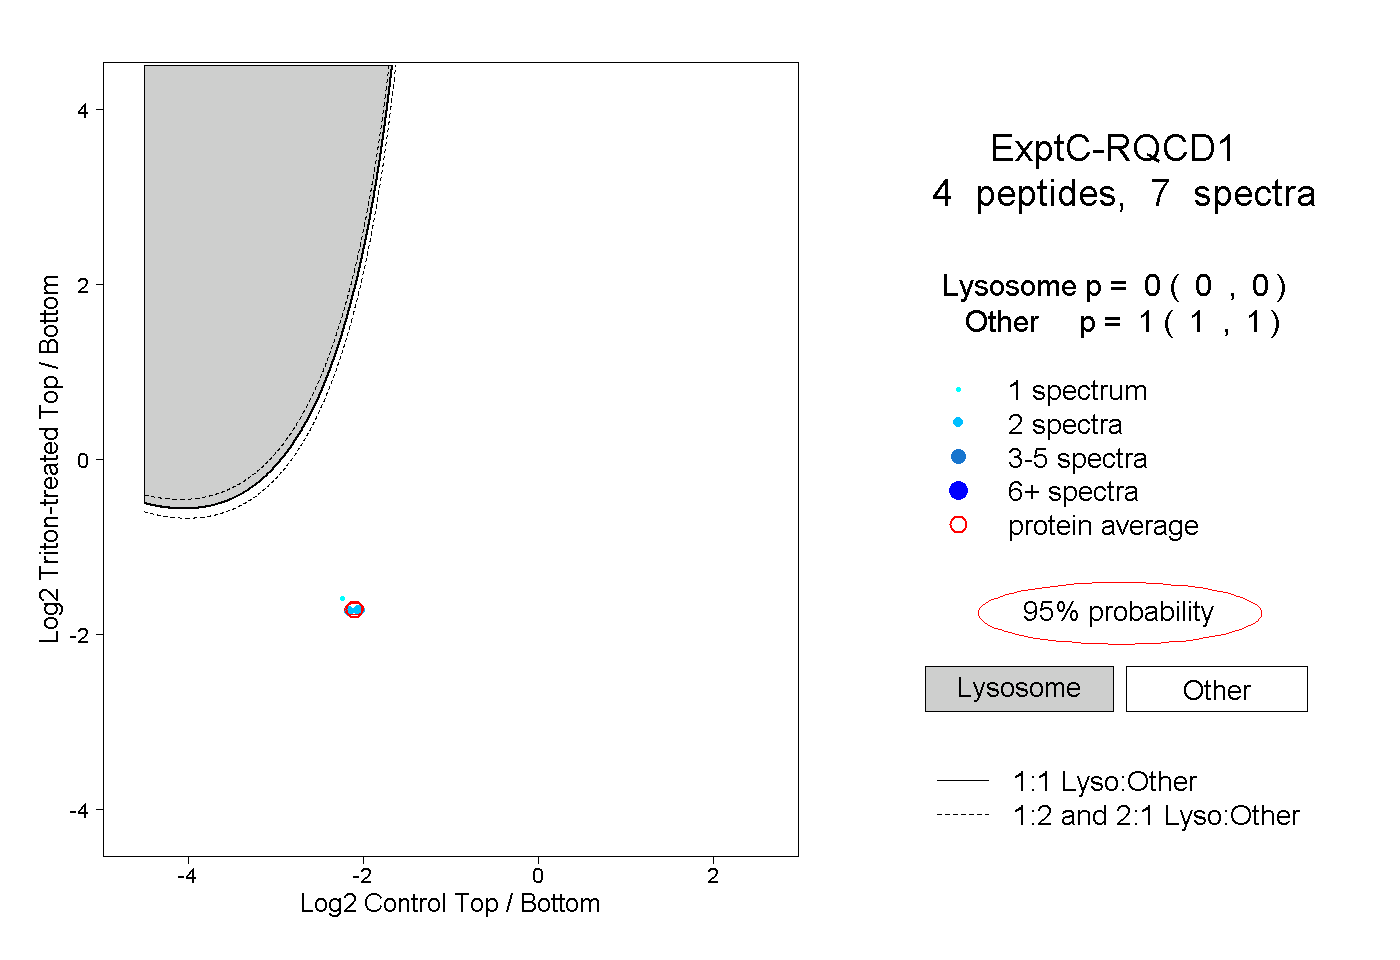 |
0.000 0.000 | 0.000 |
1.000 1.000 | 1.000 |
||||||||
| Plot | Lyso | Other | |||||||||||
| Expt D |
1 peptide |
1 spectrum |
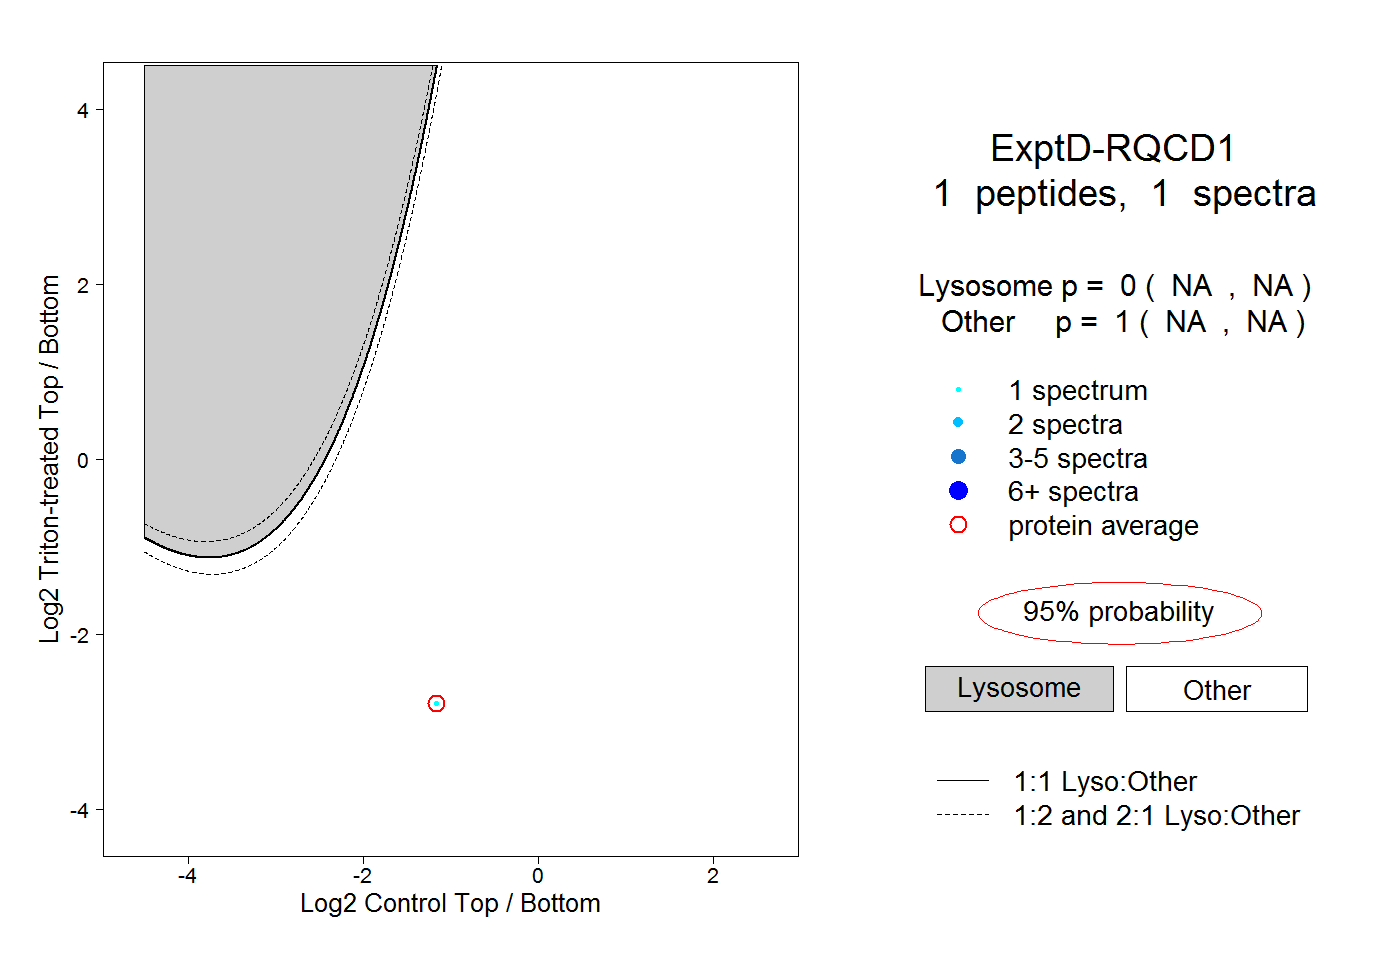 |
0.000 NA | NA |
1.000 NA | NA |