 12
12peptides
spectra
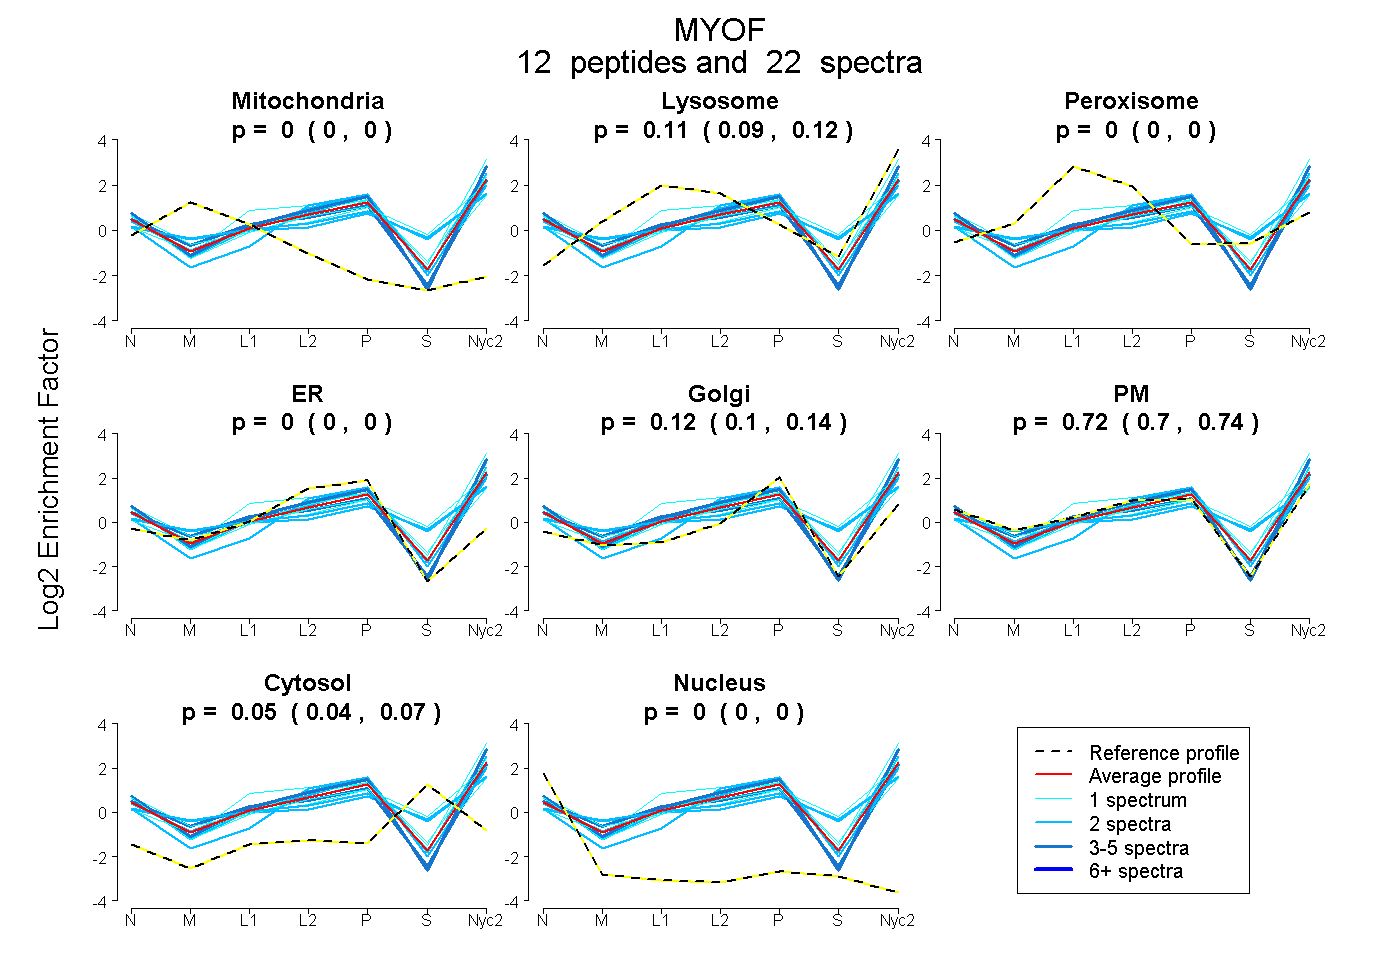
0.000 | 0.000
0.095 | 0.120
0.000 | 0.000
0.000 | 0.000
0.096 | 0.137
0.696 | 0.739
0.041 | 0.066
0.000 | 0.000
6peptides
spectra
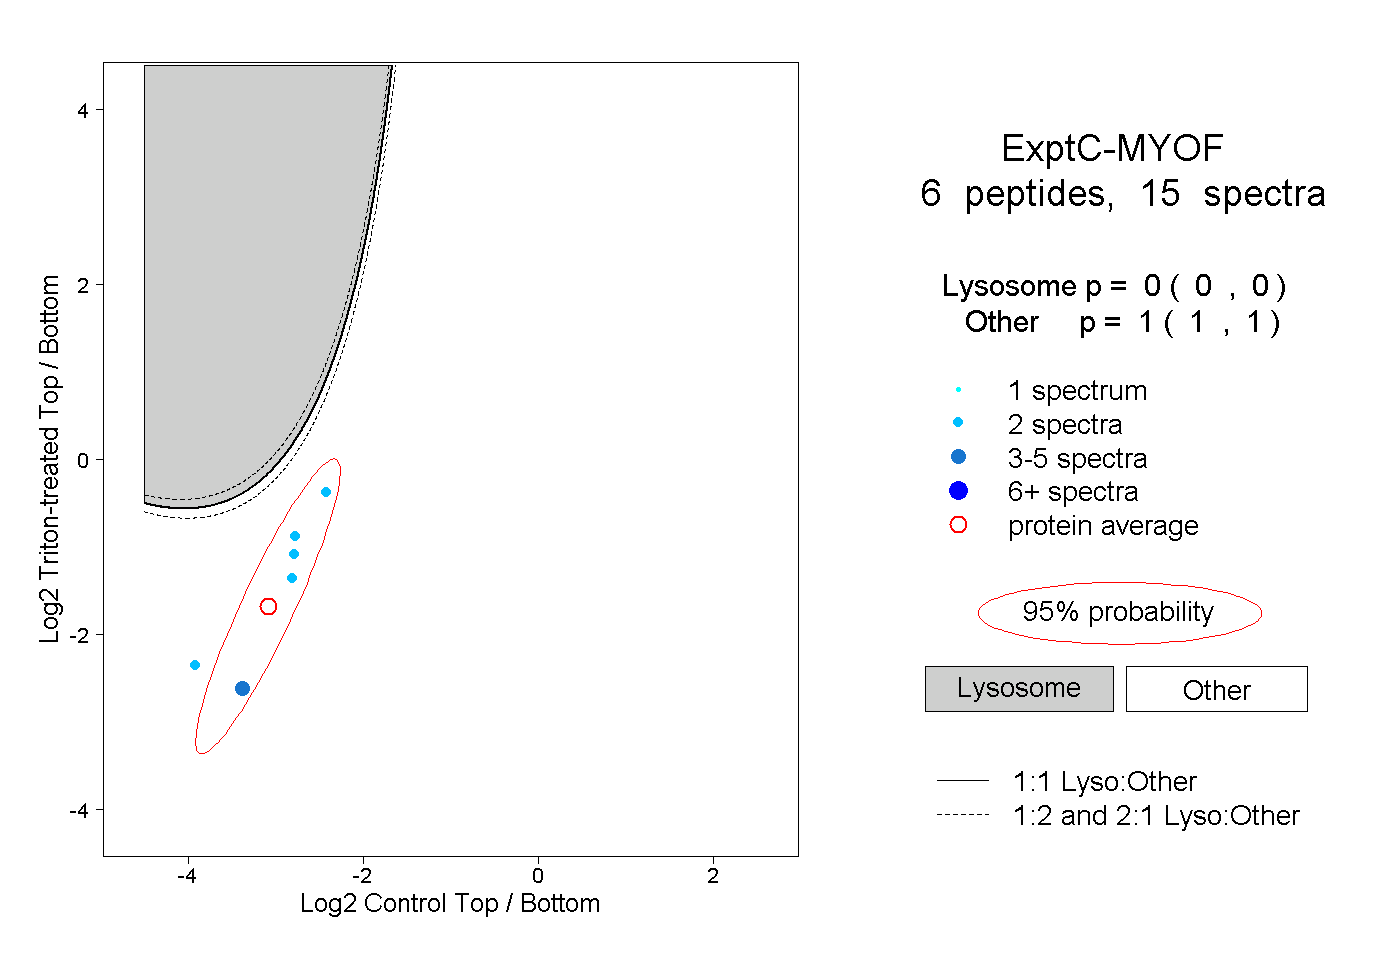
0.000 | 0.000
1.000 | 1.000
1peptide
spectrum
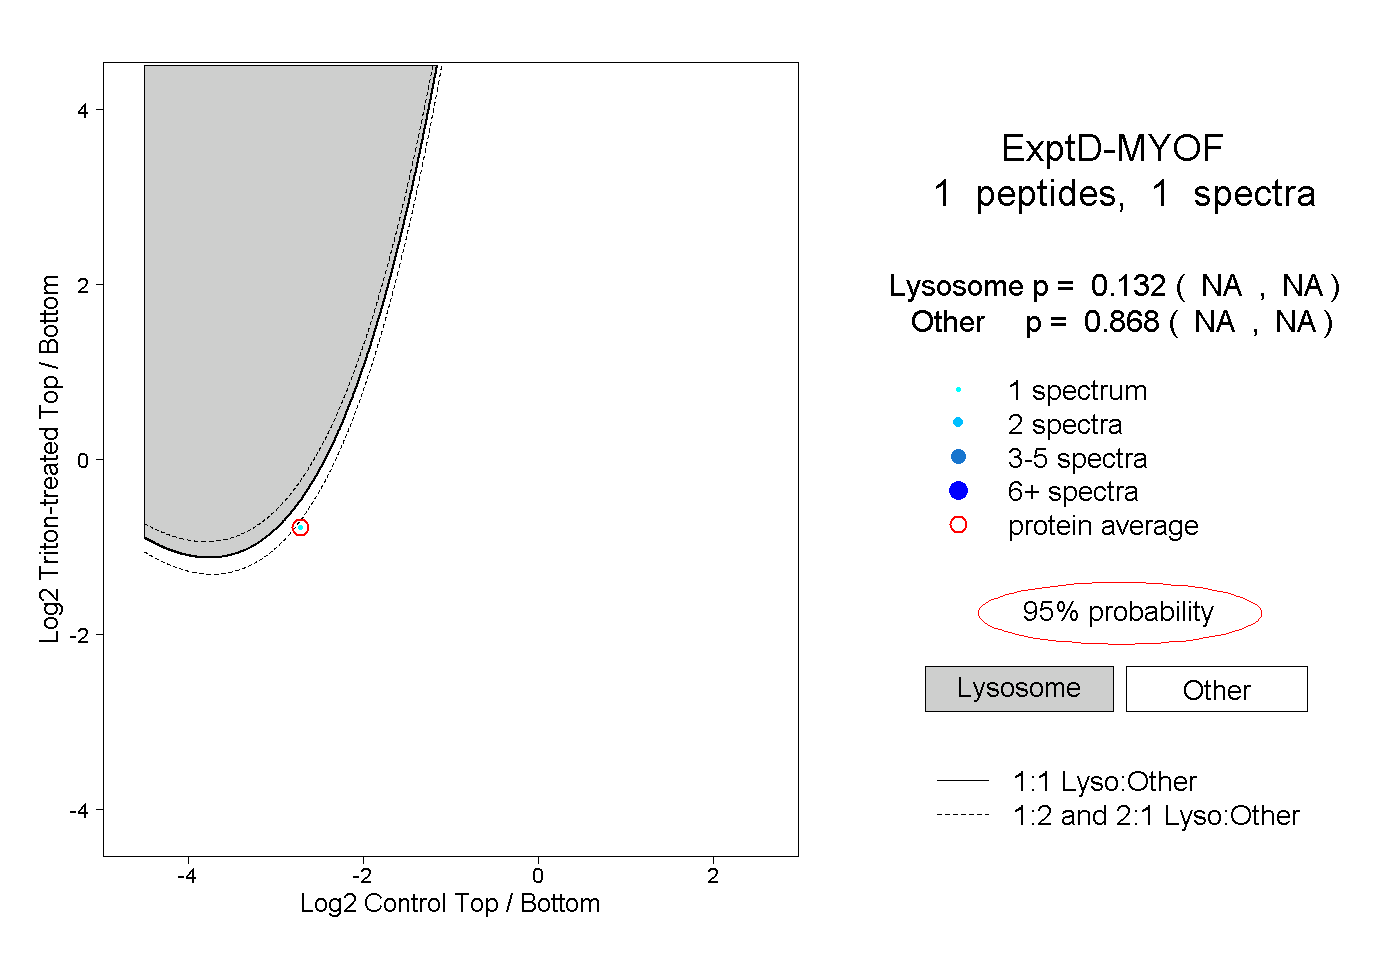
NA | NA
NA | NA