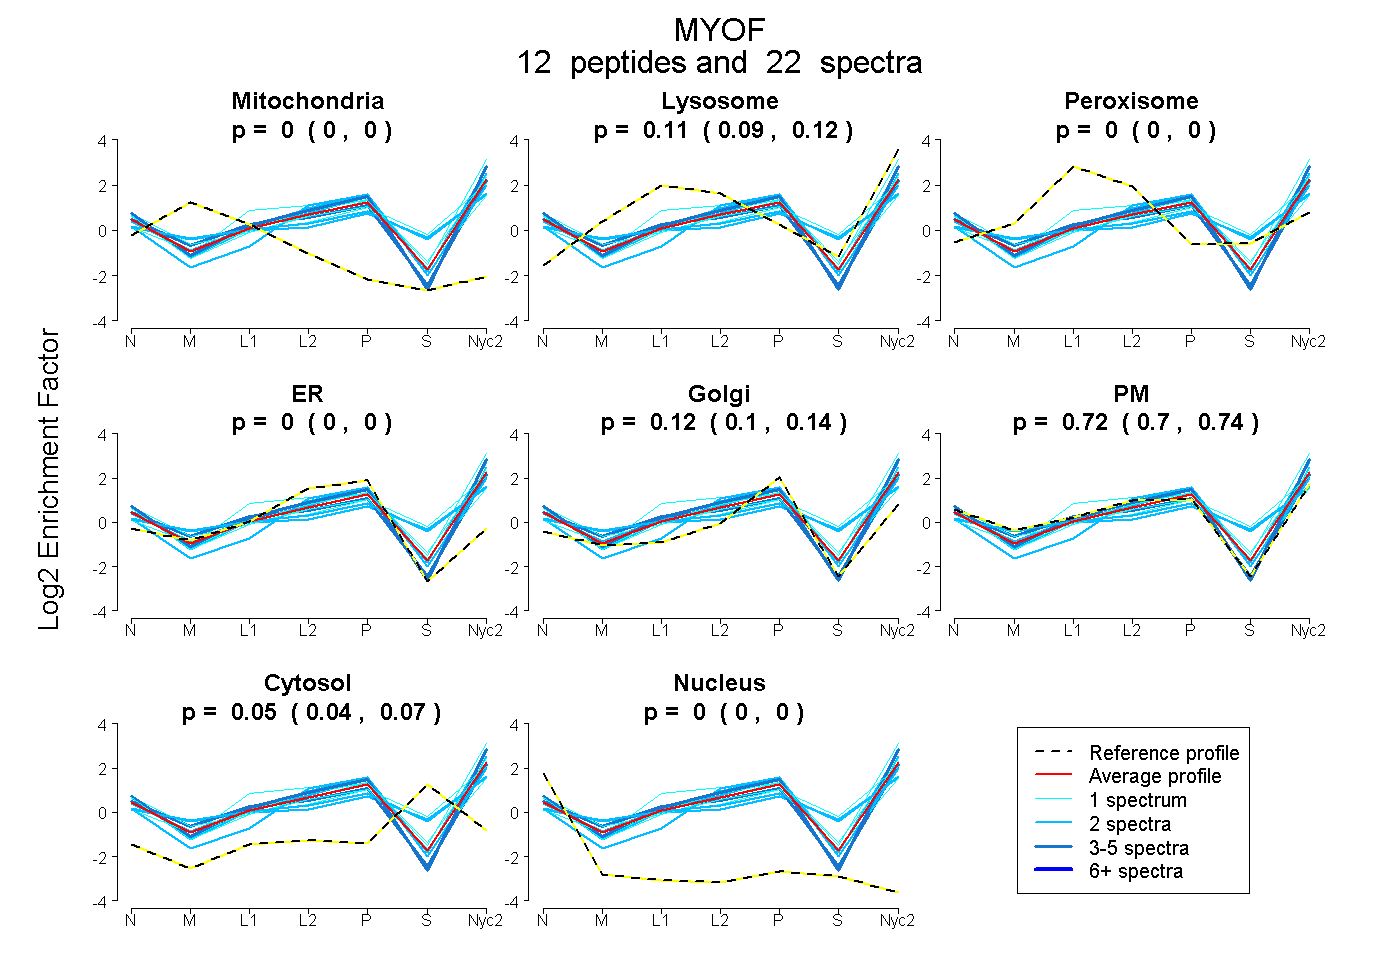
 12
12peptides
spectra
0.000 | 0.000
0.095 | 0.120
0.000 | 0.000
0.000 | 0.000
0.096 | 0.137
0.696 | 0.739
0.041 | 0.066
0.000 | 0.000
| Plot | Mito | Lyso | Perox | ER | Golgi | PM | Cytosol | Nucleus | |||||
| Expt A |
12 peptides |
22 spectra |
|
0.000 0.000 | 0.000 |
0.108 0.095 | 0.120 |
0.000 0.000 | 0.000 |
0.000 0.000 | 0.000 |
0.119 0.096 | 0.137 |
0.720 0.696 | 0.739 |
0.054 0.041 | 0.066 |
0.000 0.000 | 0.000 |
| 2 spectra, VYIYHLR | 0.000 | 0.198 | 0.000 | 0.000 | 0.000 | 0.548 | 0.255 | 0.000 | ||
| 1 spectrum, VGETTIDLENR | 0.000 | 0.071 | 0.000 | 0.000 | 0.084 | 0.749 | 0.096 | 0.000 | ||
| 2 spectra, DLTQTASSTAR | 0.000 | 0.000 | 0.000 | 0.000 | 0.092 | 0.908 | 0.000 | 0.000 | ||
| 3 spectra, LIDEVIEDTR | 0.000 | 0.041 | 0.000 | 0.000 | 0.000 | 0.959 | 0.000 | 0.000 | ||
| 2 spectra, LALHILR | 0.000 | 0.026 | 0.000 | 0.000 | 0.419 | 0.526 | 0.029 | 0.000 | ||
| 2 spectra, AMEELEDR | 0.000 | 0.191 | 0.000 | 0.000 | 0.160 | 0.649 | 0.000 | 0.000 | ||
| 4 spectra, DVILDEK | 0.000 | 0.071 | 0.000 | 0.000 | 0.094 | 0.835 | 0.000 | 0.000 | ||
| 1 spectrum, LQSNIEAVK | 0.000 | 0.257 | 0.000 | 0.000 | 0.062 | 0.427 | 0.255 | 0.000 | ||
| 1 spectrum, KPVVGQCTIDHLDR | 0.000 | 0.000 | 0.000 | 0.000 | 0.002 | 0.878 | 0.120 | 0.000 | ||
| 1 spectrum, EADERPAGK | 0.000 | 0.072 | 0.000 | 0.000 | 0.059 | 0.827 | 0.041 | 0.000 | ||
| 2 spectra, DQLRPTQLLQNVAR | 0.000 | 0.186 | 0.000 | 0.000 | 0.000 | 0.529 | 0.285 | 0.000 | ||
| 1 spectrum, ADSLMGEFK | 0.000 | 0.299 | 0.000 | 0.000 | 0.000 | 0.701 | 0.000 | 0.000 |
| Plot | Lyso | Other | |||||||||||
| Expt C |
6 peptides |
15 spectra |
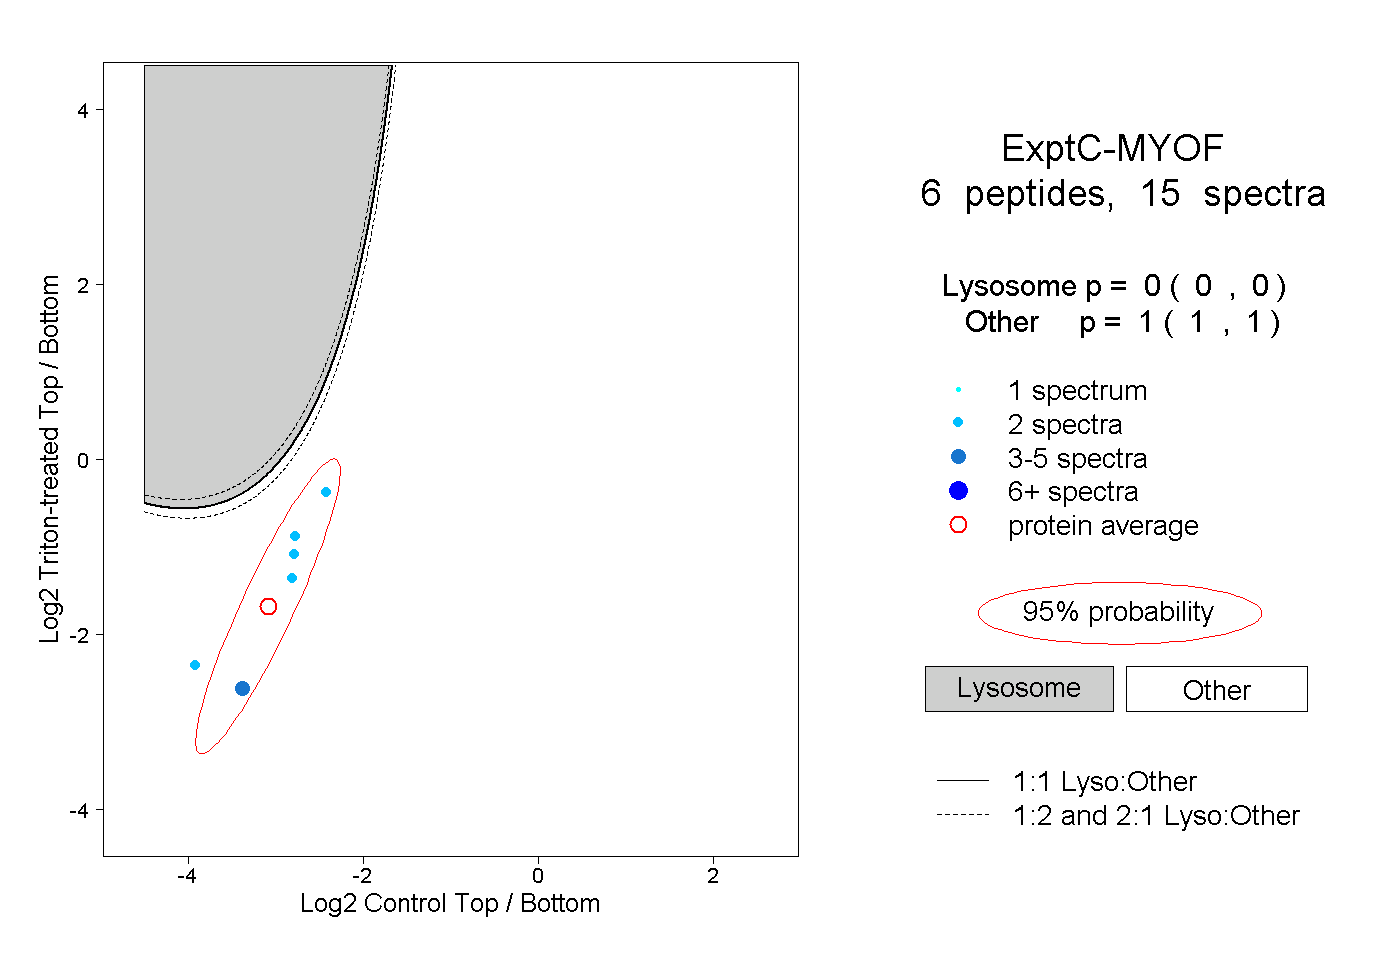 |
0.000 0.000 | 0.000 |
1.000 1.000 | 1.000 |
||||||||
| Plot | Lyso | Other | |||||||||||
| Expt D |
1 peptide |
1 spectrum |
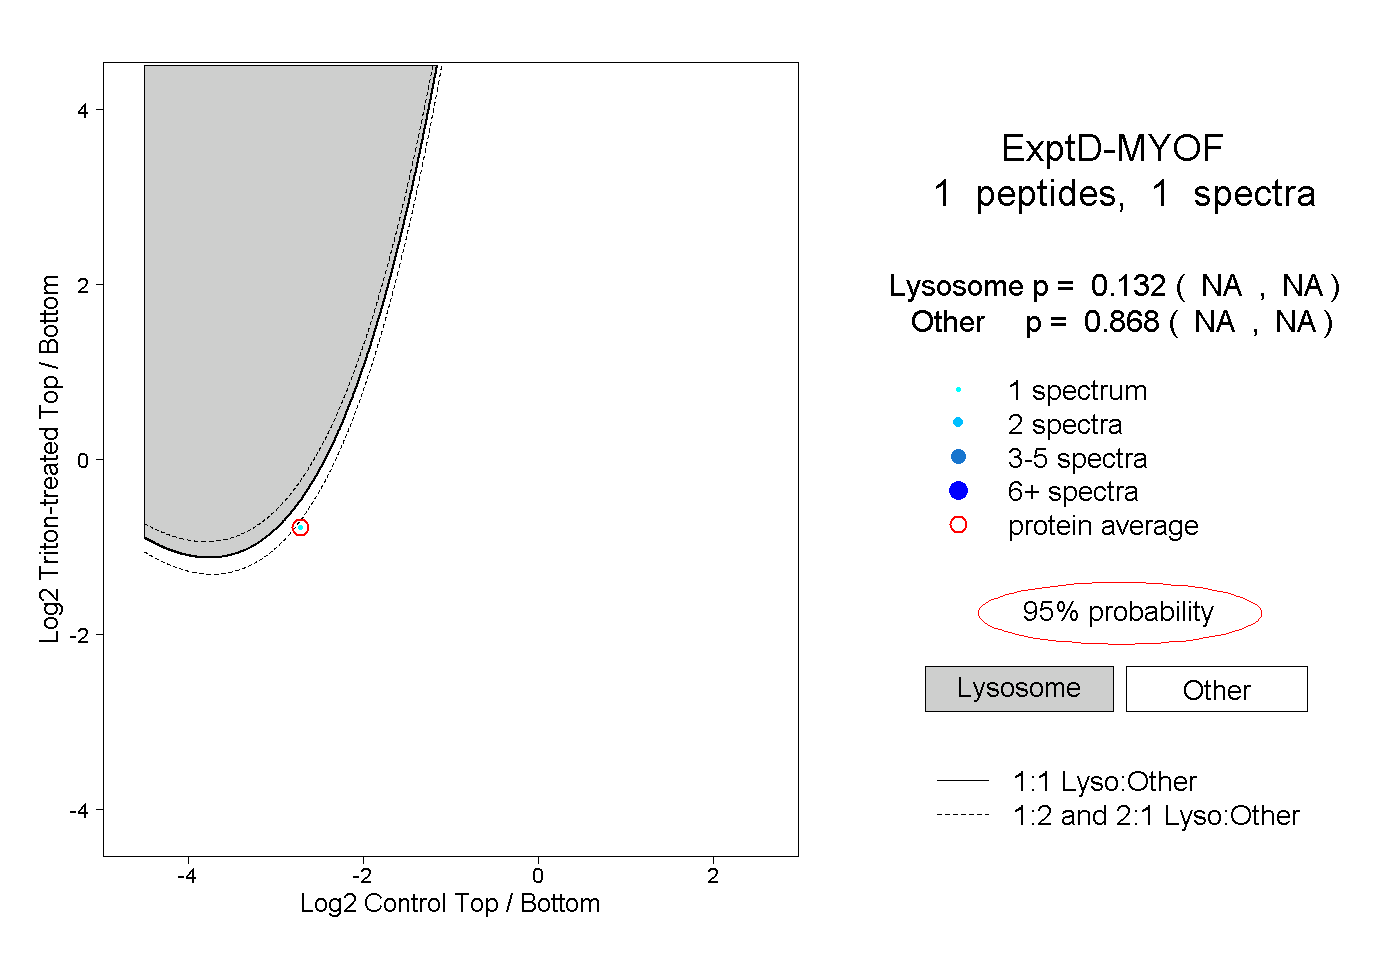 |
0.132 NA | NA |
0.868 NA | NA |