 5
5peptides
spectra
0.000 | 0.263
0.000 | 0.000
0.000 | 0.154
0.000 | 0.182
0.000 | 0.180
0.000 | 0.164
0.357 | 0.520
0.130 | 0.317
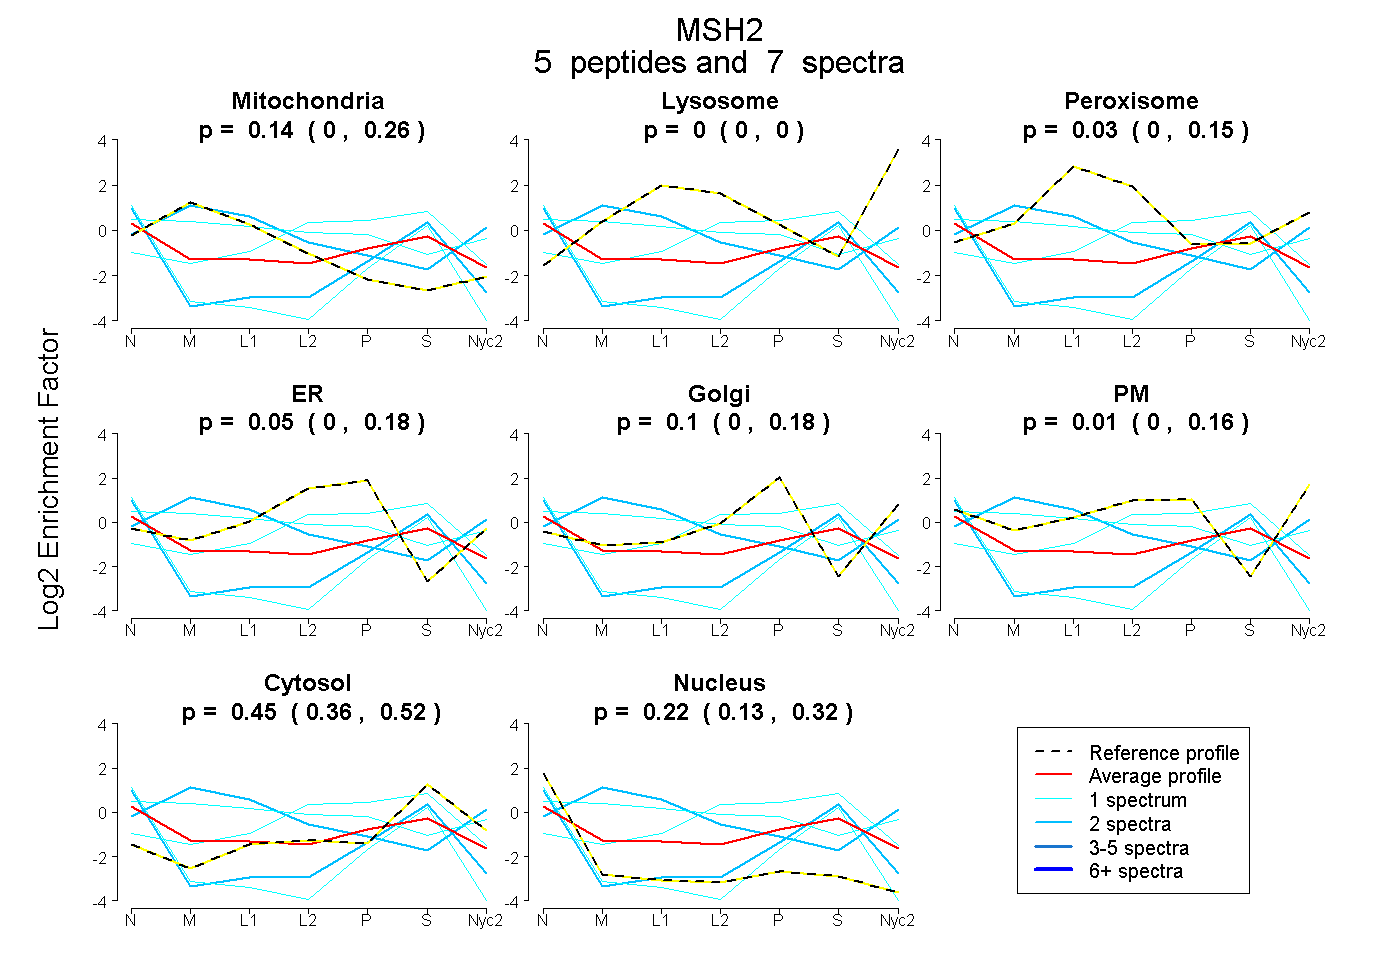
| Plot | Mito | Lyso | Perox | ER | Golgi | PM | Cytosol | Nucleus | |||||
| Expt A |
5 peptides |
7 spectra |
|
0.142 0.000 | 0.263 |
0.000 0.000 | 0.000 |
0.032 0.000 | 0.154 |
0.047 0.000 | 0.182 |
0.095 0.000 | 0.180 |
0.012 0.000 | 0.164 |
0.446 0.357 | 0.520 |
0.225 0.130 | 0.317 |