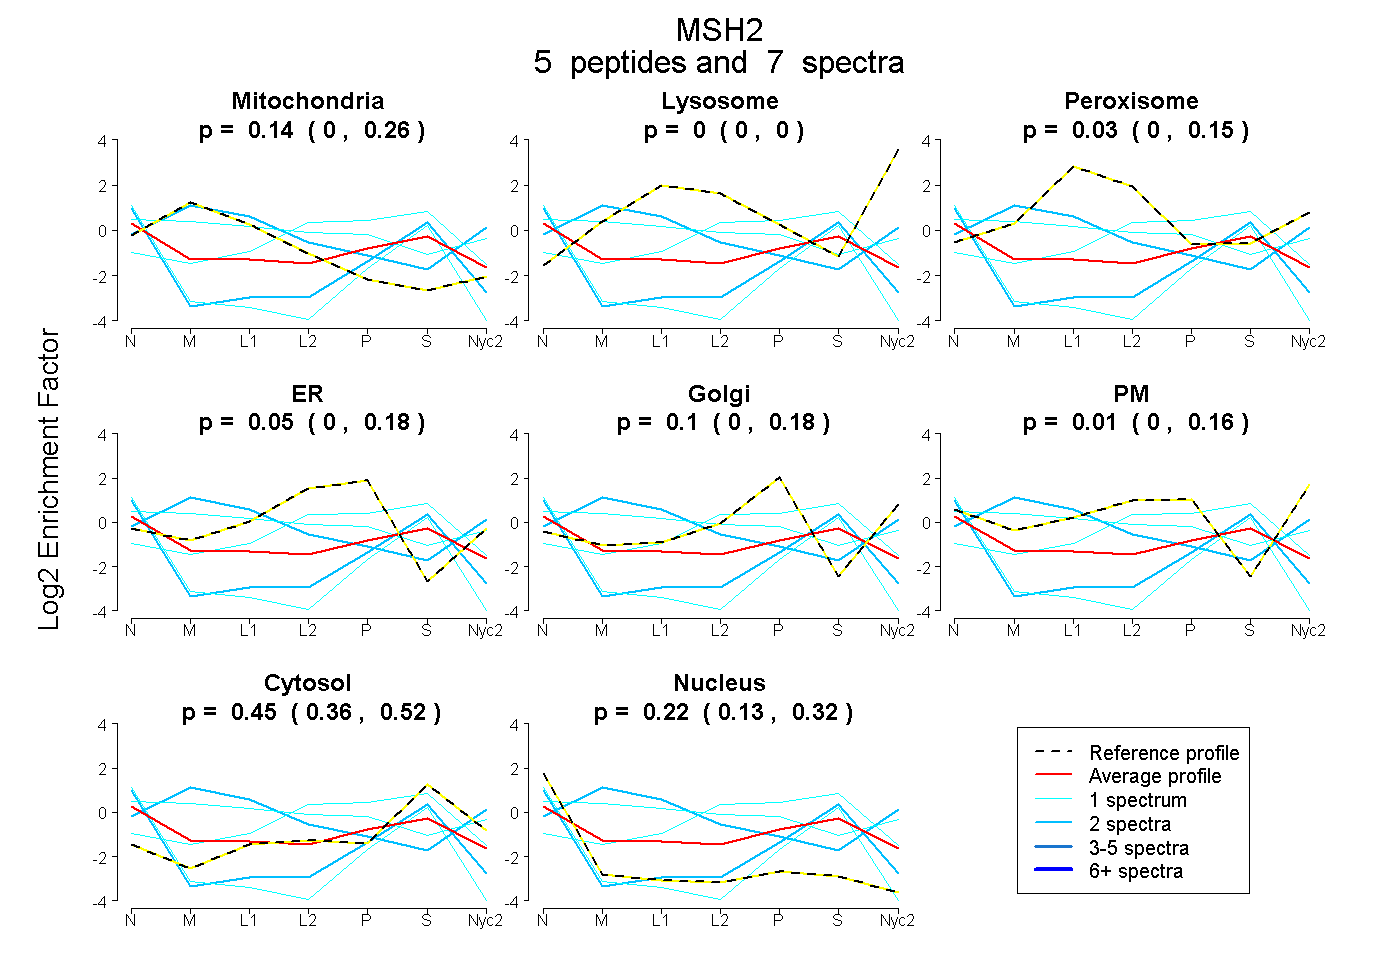
 5
5peptides
spectra
0.000 | 0.263
0.000 | 0.000
0.000 | 0.154
0.000 | 0.182
0.000 | 0.180
0.000 | 0.164
0.357 | 0.520
0.130 | 0.317
| Plot | Mito | Lyso | Perox | ER | Golgi | PM | Cytosol | Nucleus | |||||
| Expt A |
5 peptides |
7 spectra |
|
0.142 0.000 | 0.263 |
0.000 0.000 | 0.000 |
0.032 0.000 | 0.154 |
0.047 0.000 | 0.182 |
0.095 0.000 | 0.180 |
0.012 0.000 | 0.164 |
0.446 0.357 | 0.520 |
0.225 0.130 | 0.317 |
| 1 spectrum, MNFESFVK | 0.000 | 0.000 | 0.009 | 0.358 | 0.000 | 0.000 | 0.633 | 0.000 | ||
| 1 spectrum, QMFHIITGPNMGGK | 0.337 | 0.000 | 0.113 | 0.000 | 0.000 | 0.384 | 0.166 | 0.000 | ||
| 2 spectra, FPDLNR | 0.593 | 0.270 | 0.000 | 0.000 | 0.000 | 0.098 | 0.039 | 0.000 | ||
| 1 spectrum, LNLVEAFVEDSELR | 0.000 | 0.000 | 0.000 | 0.000 | 0.000 | 0.000 | 0.305 | 0.695 | ||
| 2 spectra, IILEFLSK | 0.000 | 0.000 | 0.000 | 0.000 | 0.000 | 0.000 | 0.477 | 0.523 |