 6
6peptides
spectra
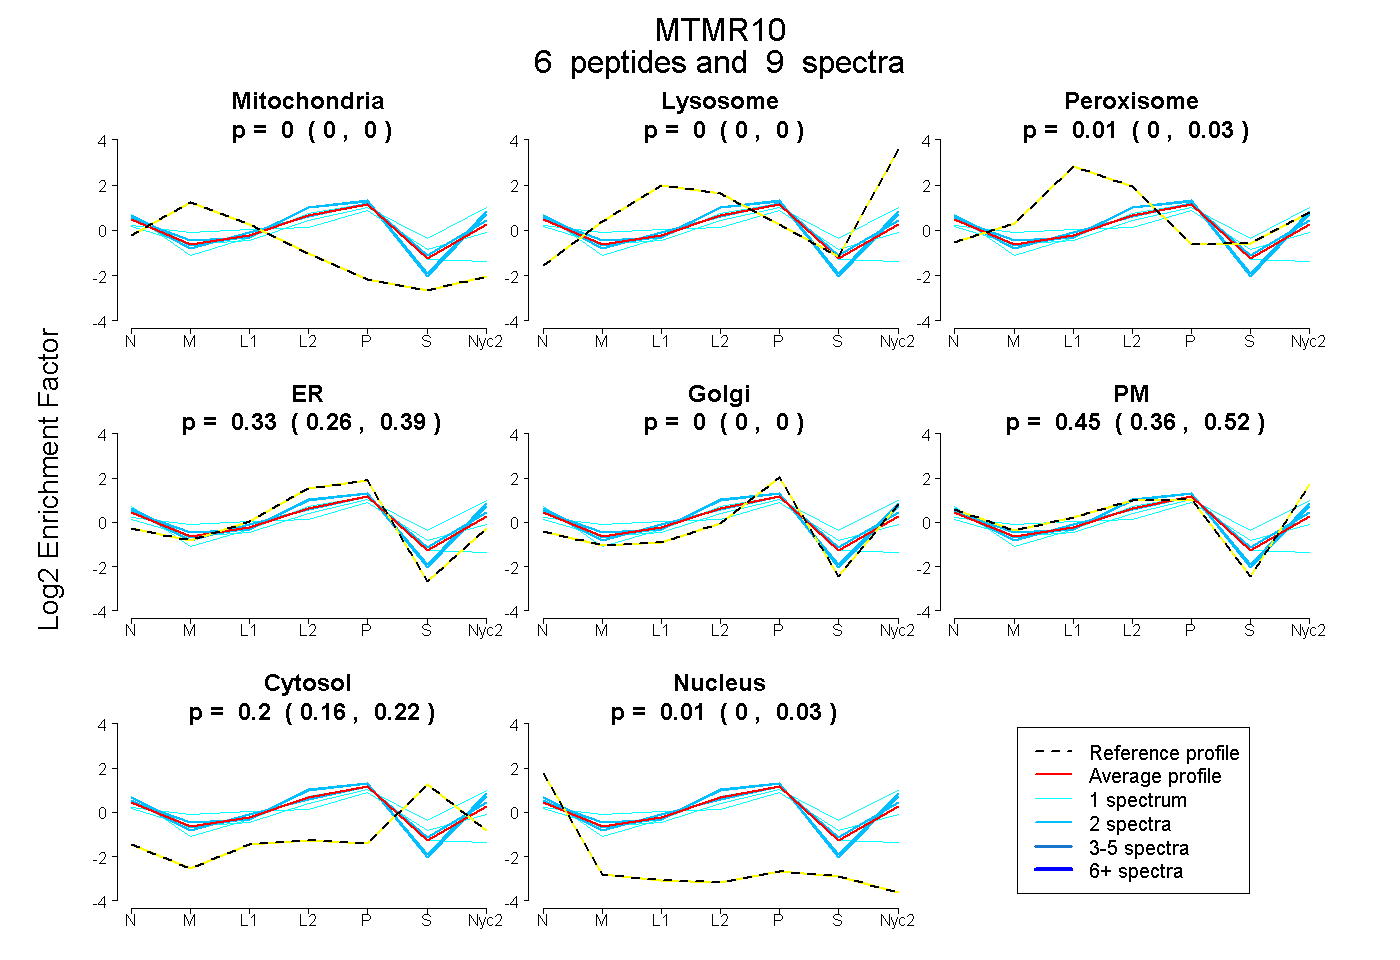
0.000 | 0.000
0.000 | 0.000
0.000 | 0.033
0.259 | 0.389
0.000 | 0.000
0.357 | 0.520
0.161 | 0.217
0.000 | 0.030
1peptide
spectrum
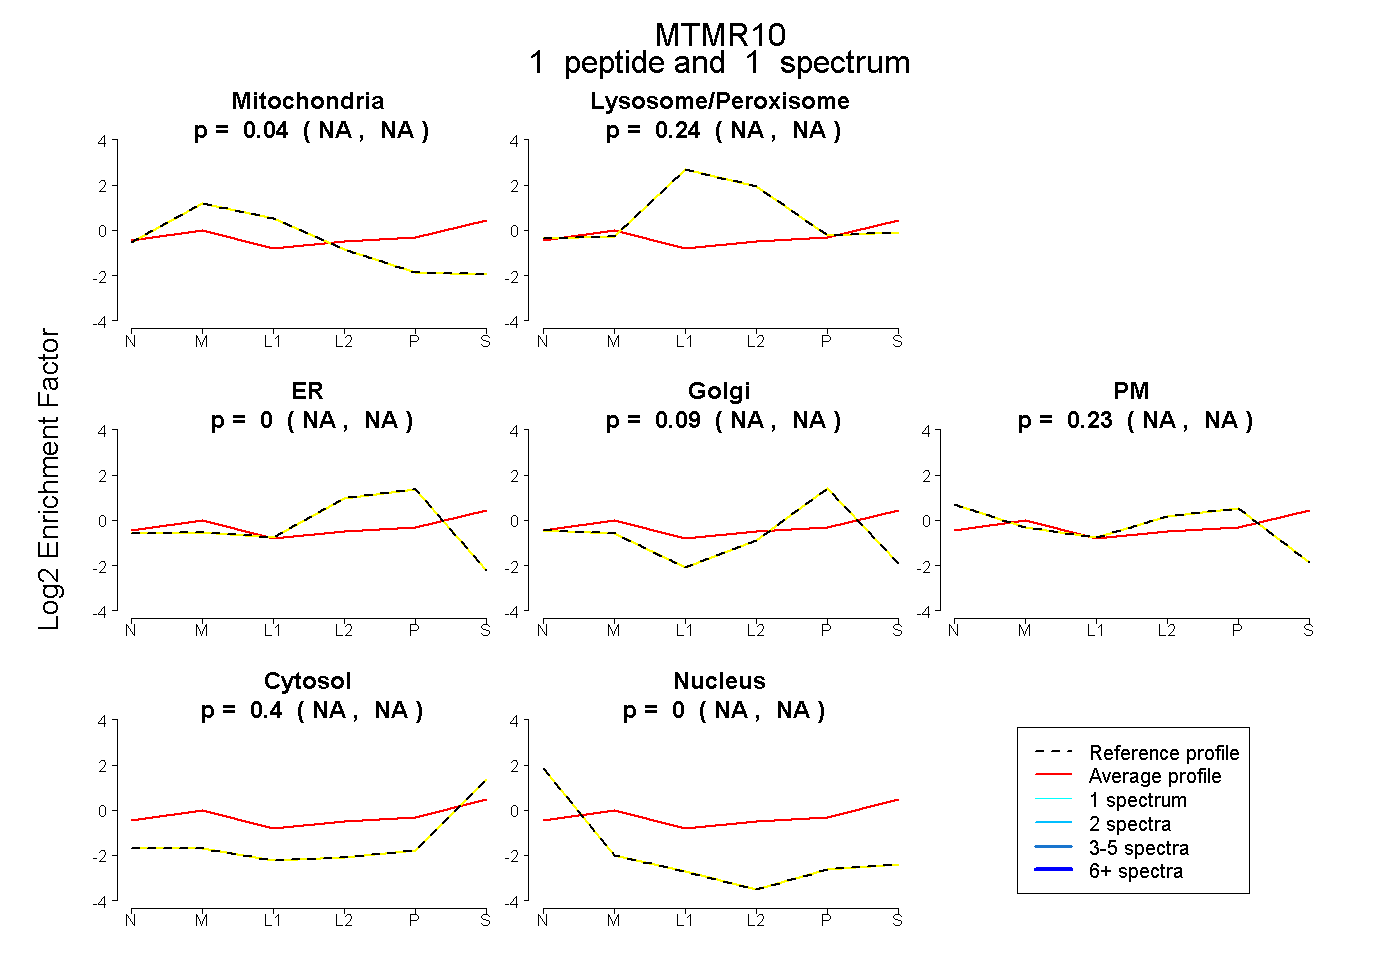
NA | NA
NA | NA
NA | NA
NA | NA
NA | NA
NA | NA
NA | NA
4peptides
spectra
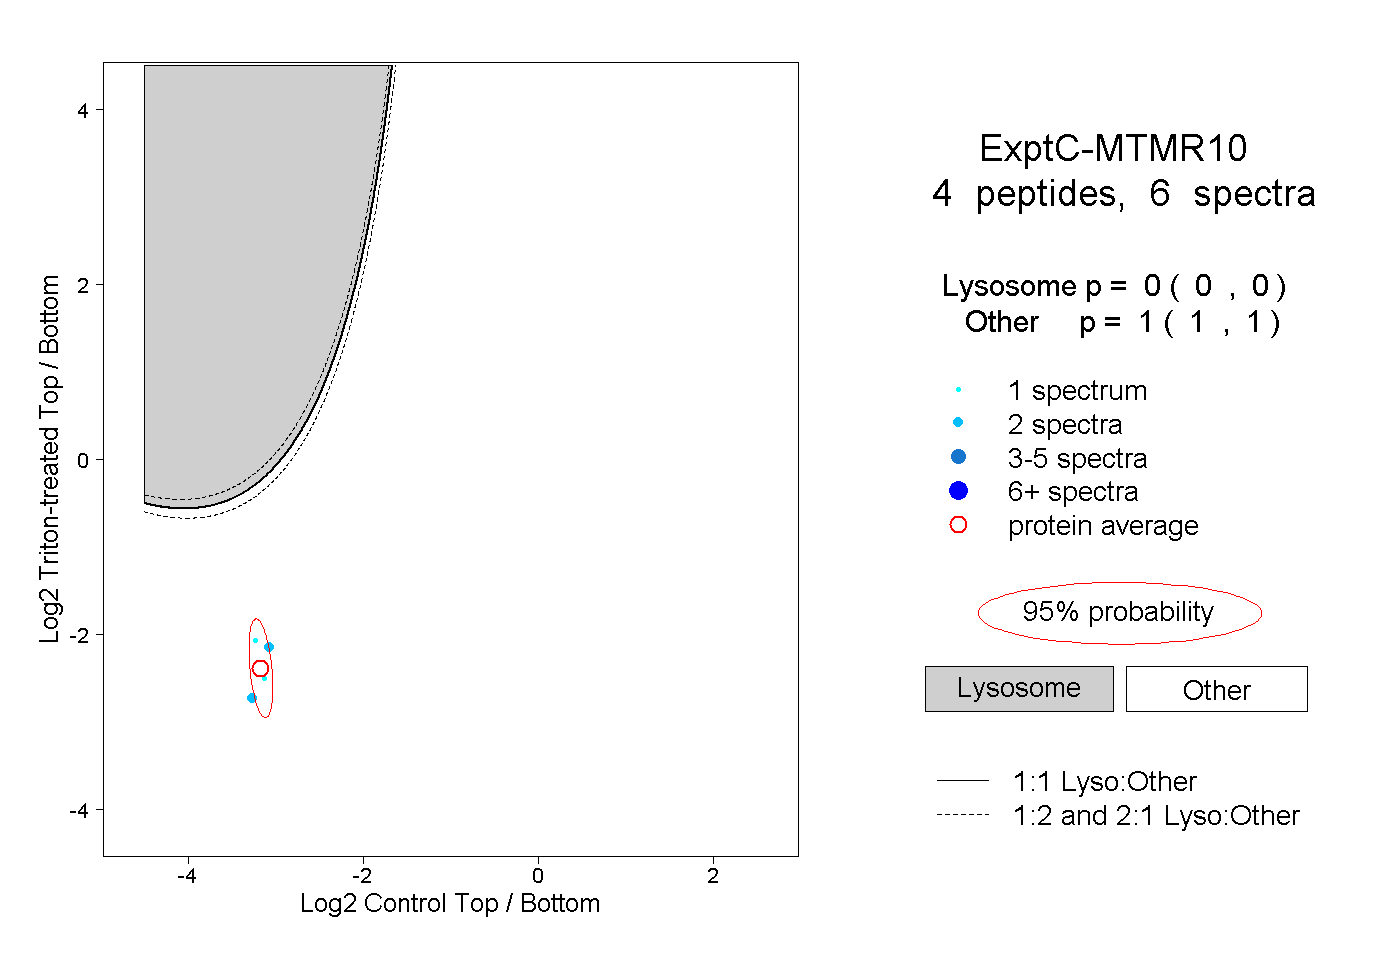
0.000 | 0.000
1.000 | 1.000