 10
10peptides
spectra
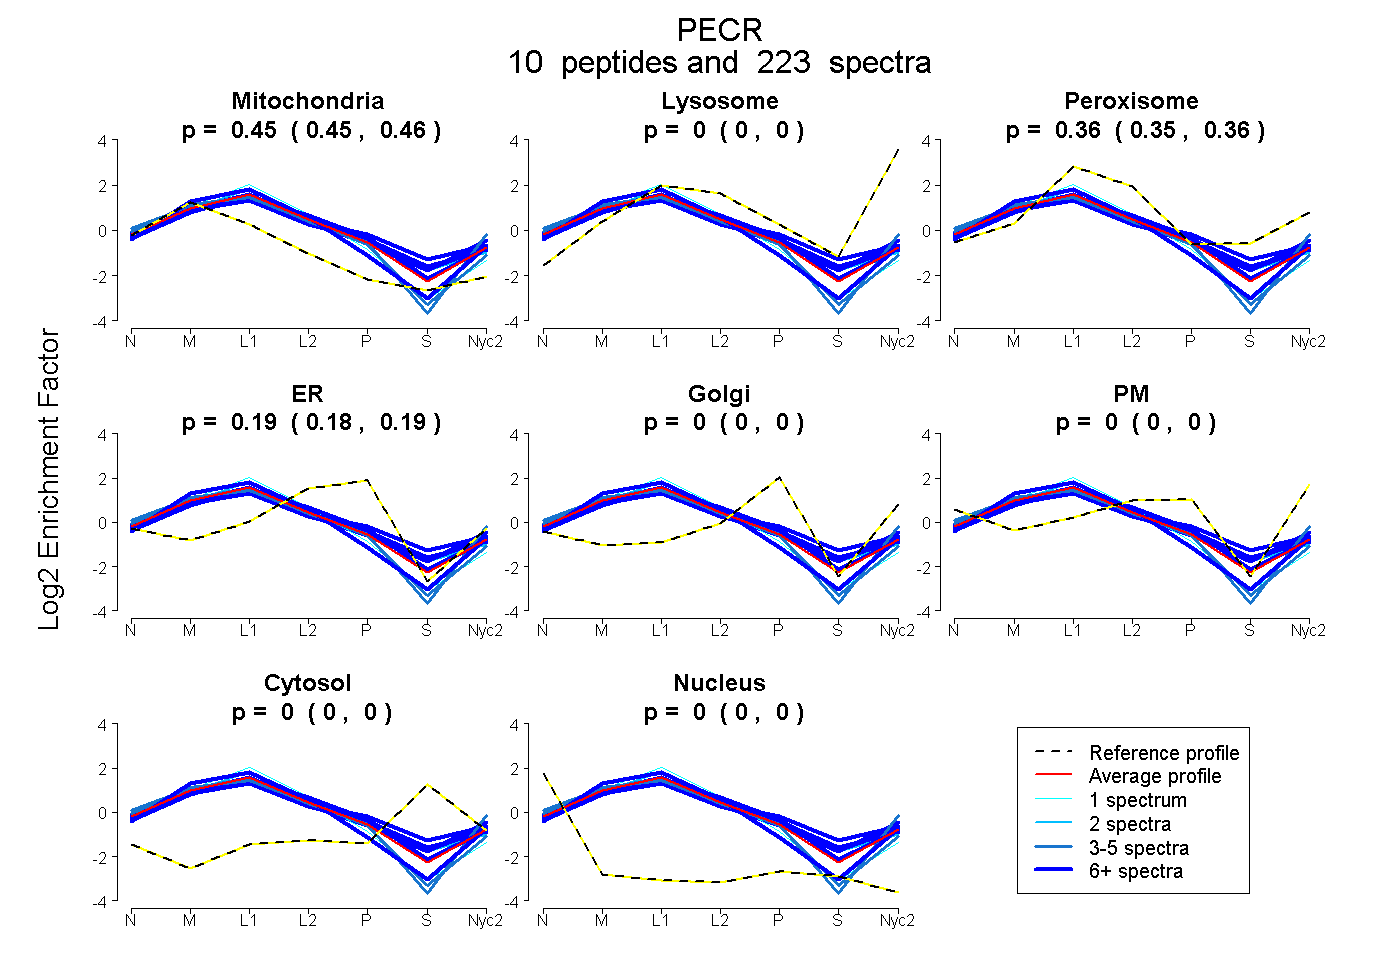
0.451 | 0.456
0.000 | 0.000
0.354 | 0.363
0.183 | 0.191
0.000 | 0.000
0.000 | 0.000
0.000 | 0.000
0.000 | 0.000
10peptides
spectra
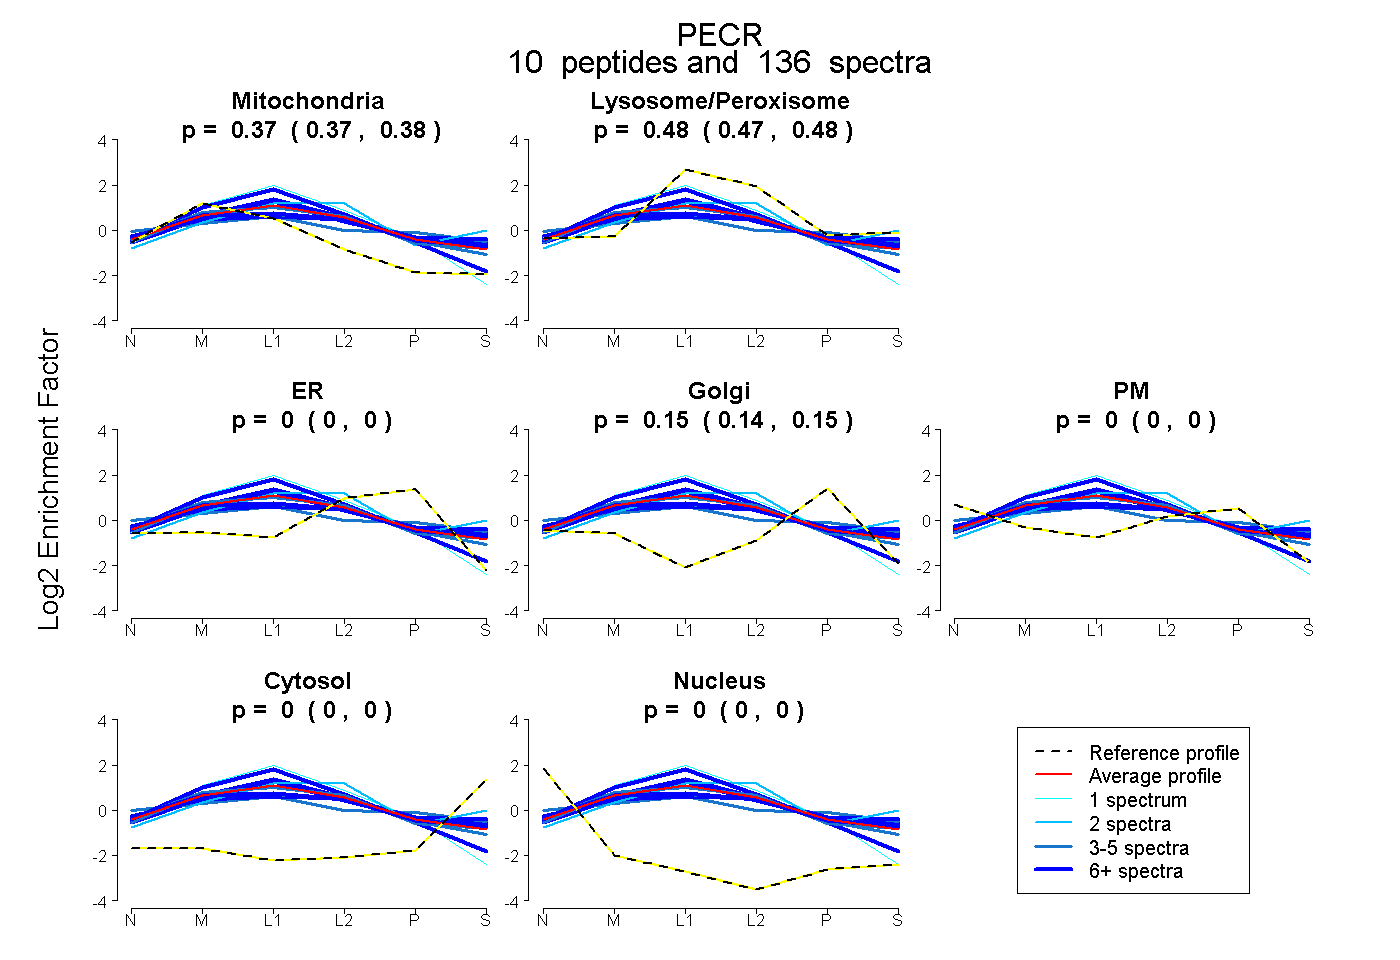
0.370 | 0.377
0.474 | 0.482
0.000 | 0.000
0.144 | 0.151
0.000 | 0.000
0.000 | 0.000
0.000 | 0.000
11peptides
spectra
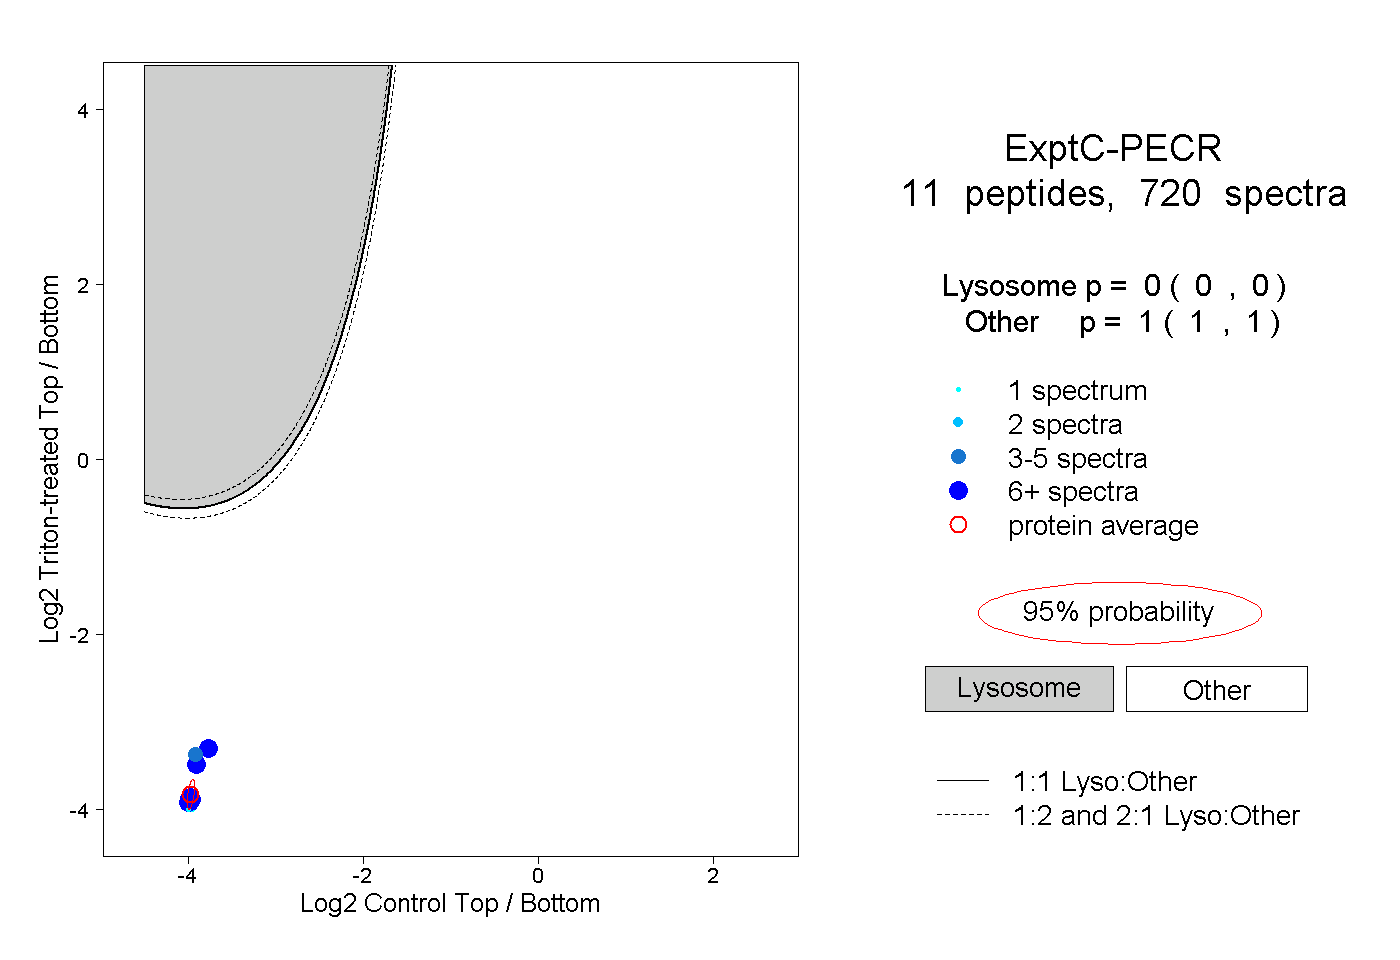
0.000 | 0.000
1.000 | 1.000
7peptides
spectra
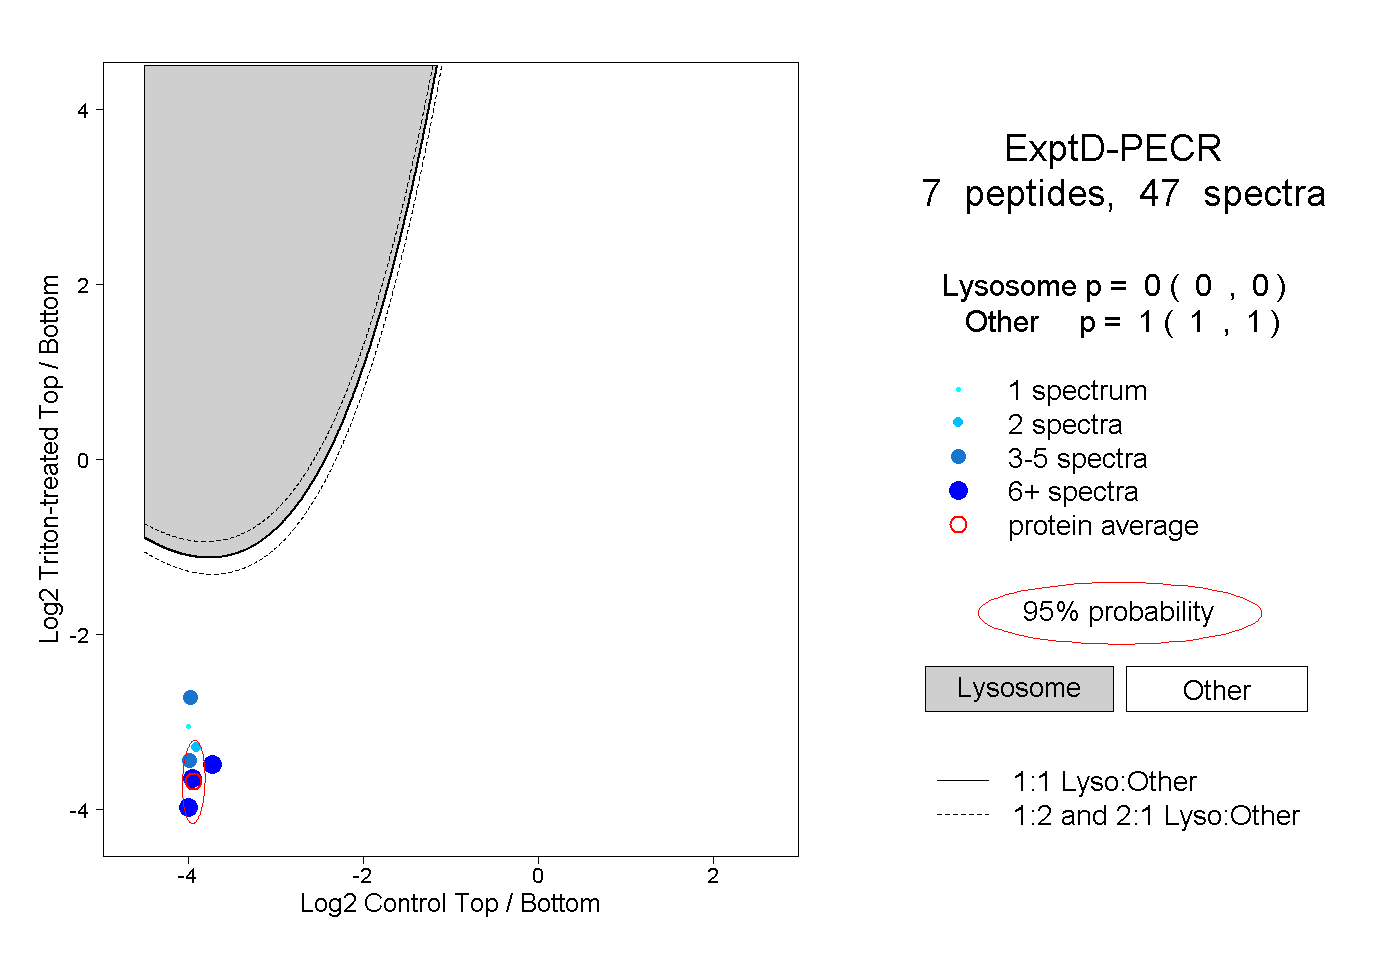
0.000 | 0.000
1.000 | 1.000