 10
10peptides
spectra
0.451 | 0.456
0.000 | 0.000
0.354 | 0.363
0.183 | 0.191
0.000 | 0.000
0.000 | 0.000
0.000 | 0.000
0.000 | 0.000
| Plot | Mito | Lyso | Perox | ER | Golgi | PM | Cytosol | Nucleus | |||||
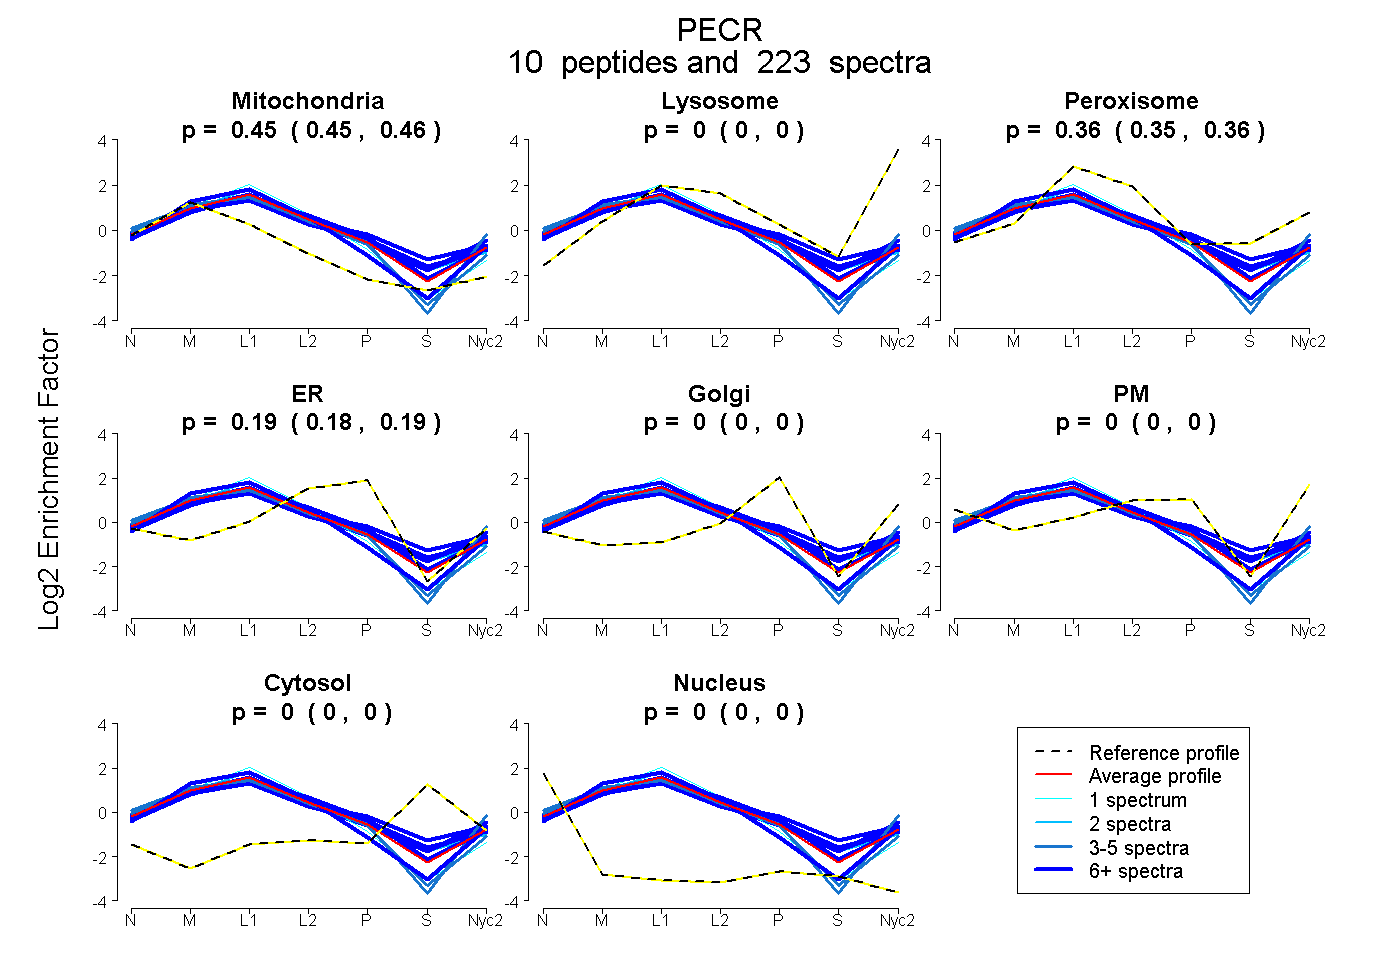
| Expt A |
10 peptides |
223 spectra |
|
0.454 0.451 | 0.456 |
0.000 0.000 | 0.000 |
0.359 0.354 | 0.363 |
0.188 0.183 | 0.191 |
0.000 0.000 | 0.000 |
0.000 0.000 | 0.000 |
0.000 0.000 | 0.000 |
0.000 0.000 | 0.000 |
| 3 spectra, INFLVNNAGGQFMAPAEDITAK | 0.482 | 0.047 | 0.112 | 0.035 | 0.000 | 0.323 | 0.000 | 0.000 | ||
| 4 spectra, NFTIPDHDNWPVGAGDSSFIK | 0.552 | 0.000 | 0.190 | 0.258 | 0.000 | 0.000 | 0.000 | 0.000 | ||
| 83 spectra, TMALTWASSGVR | 0.555 | 0.066 | 0.301 | 0.078 | 0.000 | 0.000 | 0.000 | 0.000 | ||
| 71 spectra, LTAAVDELR | 0.410 | 0.000 | 0.348 | 0.242 | 0.000 | 0.000 | 0.000 | 0.000 | ||
| 11 spectra, AVYNSWMK | 0.425 | 0.007 | 0.426 | 0.068 | 0.019 | 0.055 | 0.000 | 0.000 | ||
| 29 spectra, AGVYNLTK | 0.417 | 0.000 | 0.414 | 0.169 | 0.000 | 0.000 | 0.000 | 0.000 | ||
| 13 spectra, ELLHLGCNVVIASR | 0.436 | 0.000 | 0.368 | 0.153 | 0.043 | 0.000 | 0.000 | 0.000 | ||
| 1 spectrum, EEEVNNLVK | 0.533 | 0.000 | 0.315 | 0.152 | 0.000 | 0.000 | 0.000 | 0.000 | ||
| 6 spectra, GWQAVIETNLTGTFYMCK | 0.355 | 0.000 | 0.463 | 0.101 | 0.080 | 0.000 | 0.000 | 0.000 | ||
| 2 spectra, ASQPPSSSTQVTAIQCNIR | 0.426 | 0.000 | 0.421 | 0.153 | 0.000 | 0.000 | 0.000 | 0.000 |
| Plot | Mito | Lyso or Perox | ER | Golgi | PM | Cytosol | Nucleus | ||||||
| Expt B |
10 peptides |
136 spectra |
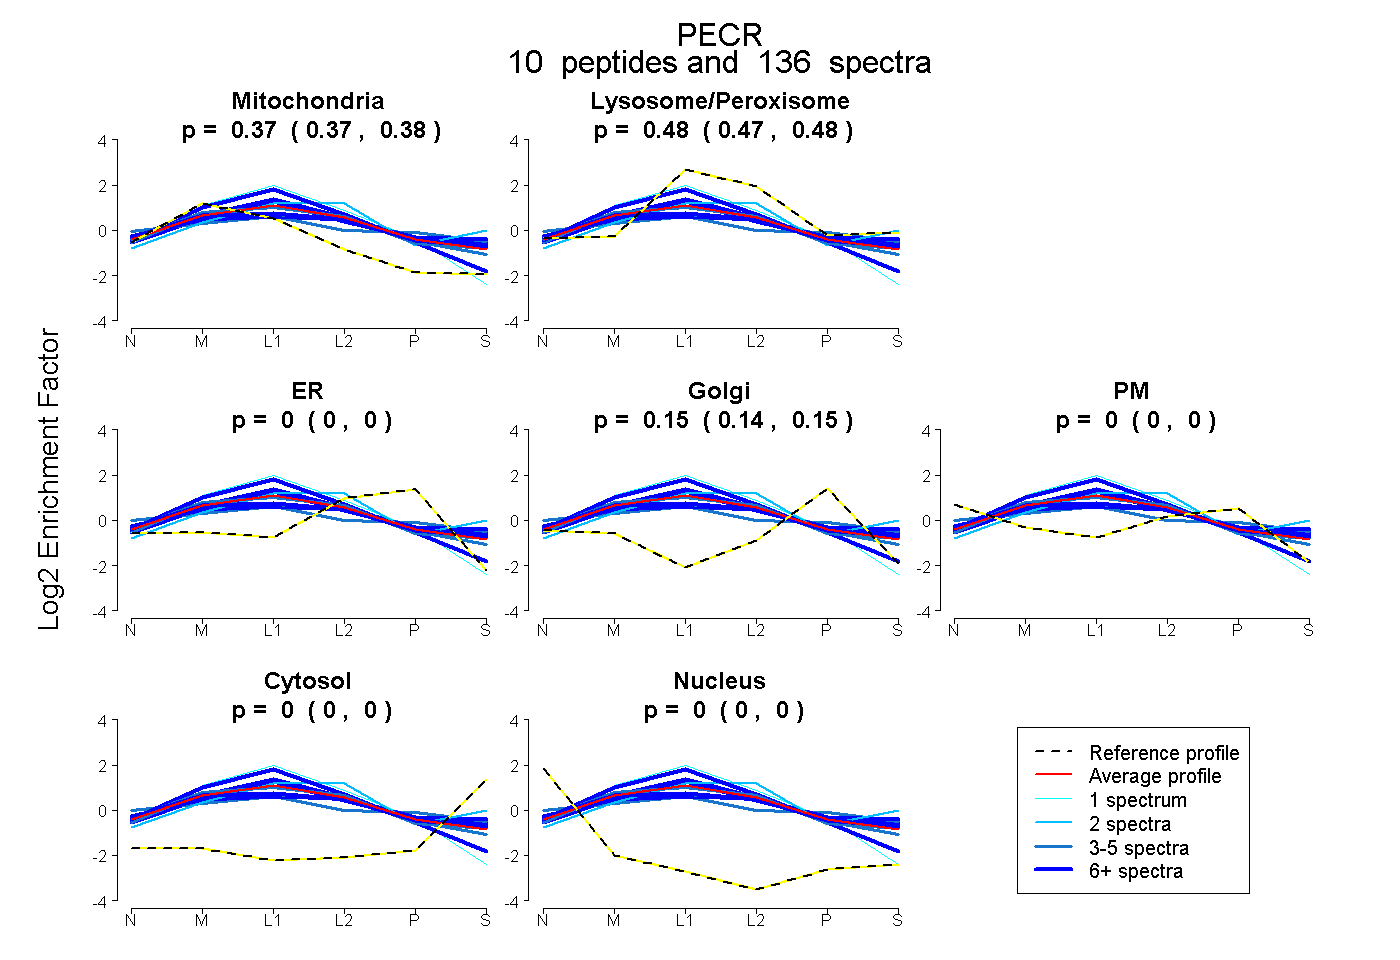 |
0.374 0.370 | 0.377 |
0.478 0.474 | 0.482 |
0.000 0.000 | 0.000 |
0.148 0.144 | 0.151 |
0.000 0.000 | 0.000 |
0.000 0.000 | 0.000 |
0.000 0.000 | 0.000 |
|||
| Plot | Lyso | Other | |||||||||||
| Expt C |
11 peptides |
720 spectra |
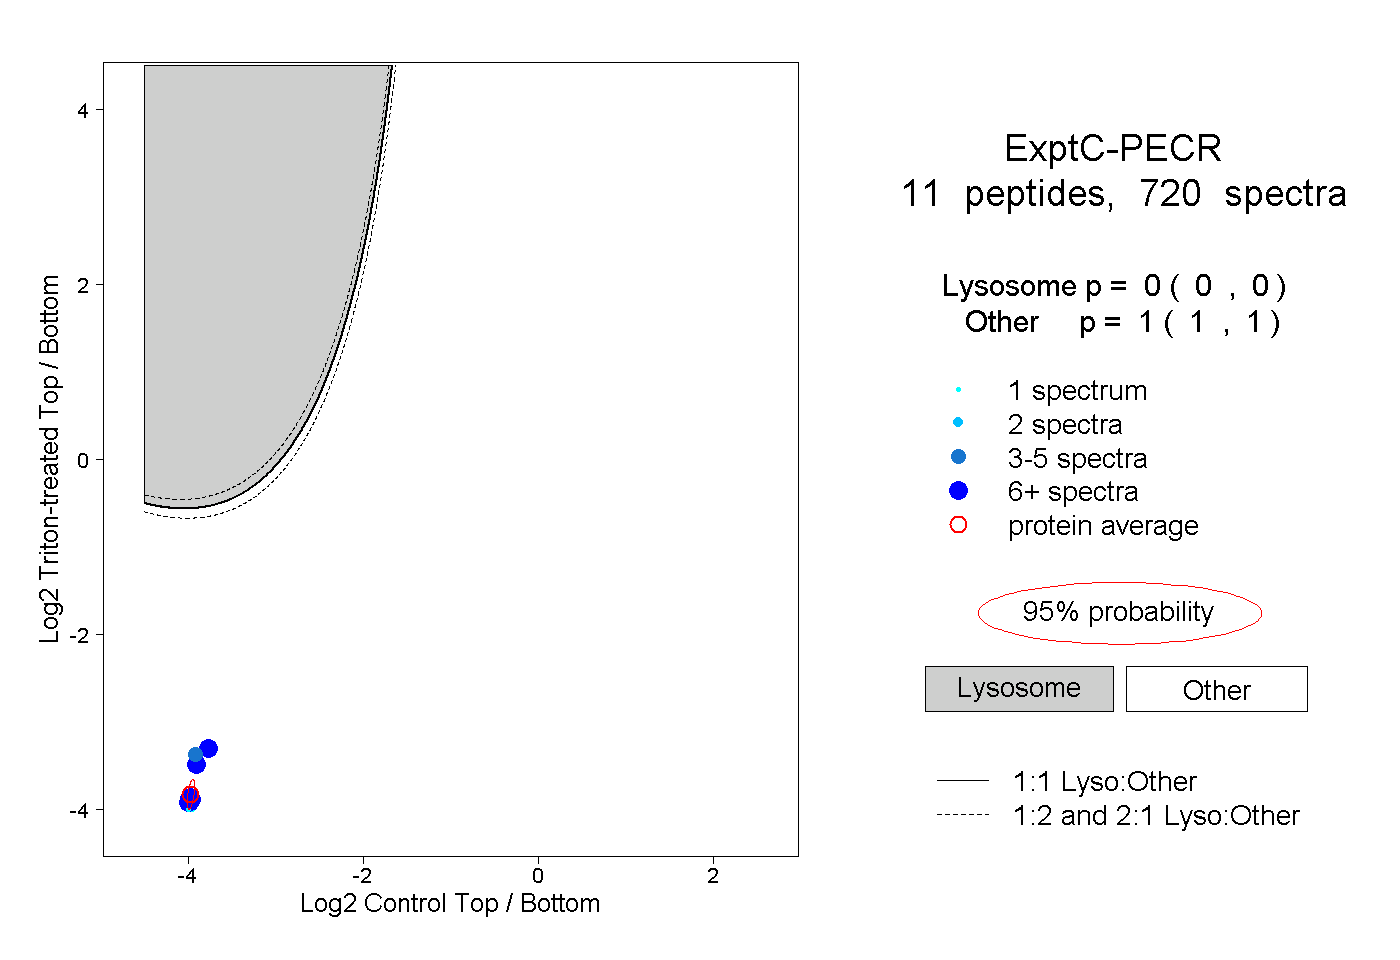 |
0.000 0.000 | 0.000 |
1.000 1.000 | 1.000 |
||||||||
| Plot | Lyso | Other | |||||||||||
| Expt D |
7 peptides |
47 spectra |
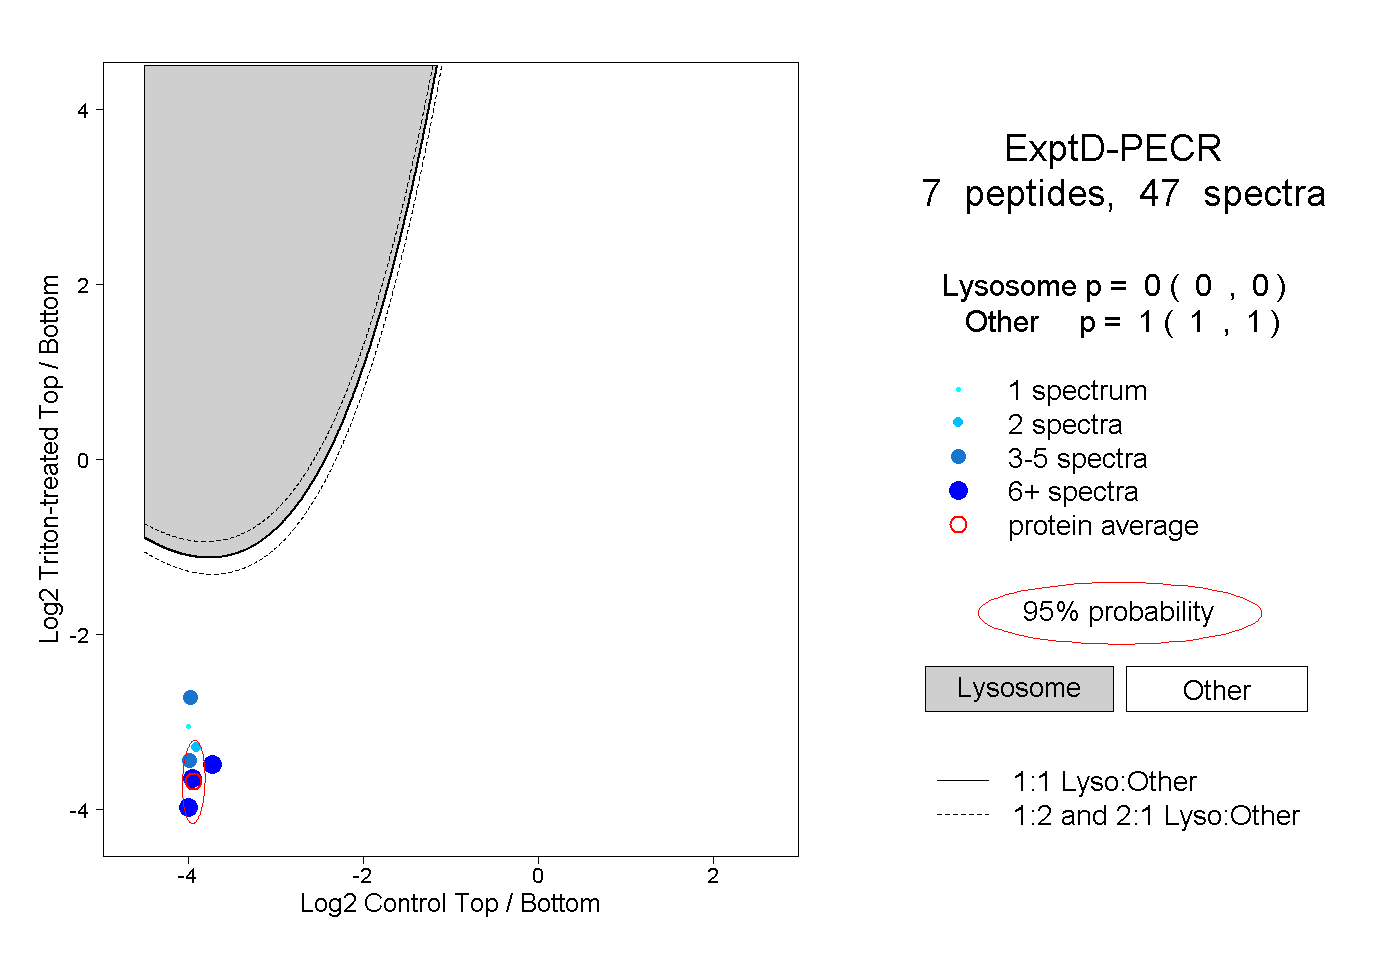 |
0.000 0.000 | 0.000 |
1.000 1.000 | 1.000 |