 5
5peptides
spectra
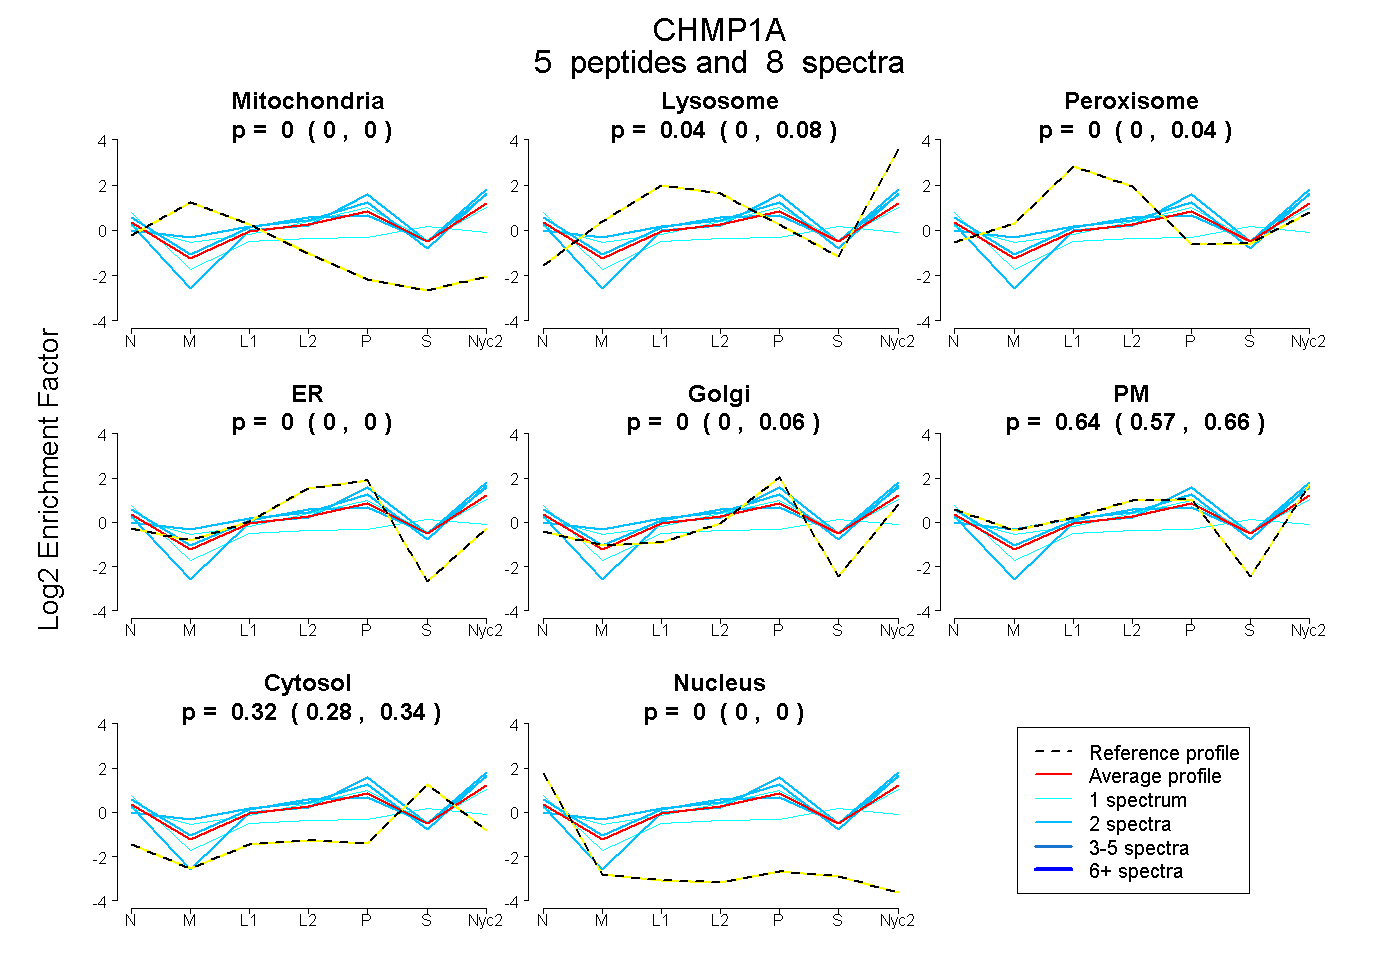
0.000 | 0.000
0.000 | 0.076
0.000 | 0.041
0.000 | 0.000
0.000 | 0.059
0.570 | 0.663
0.283 | 0.337
0.000 | 0.000
1peptide
spectrum
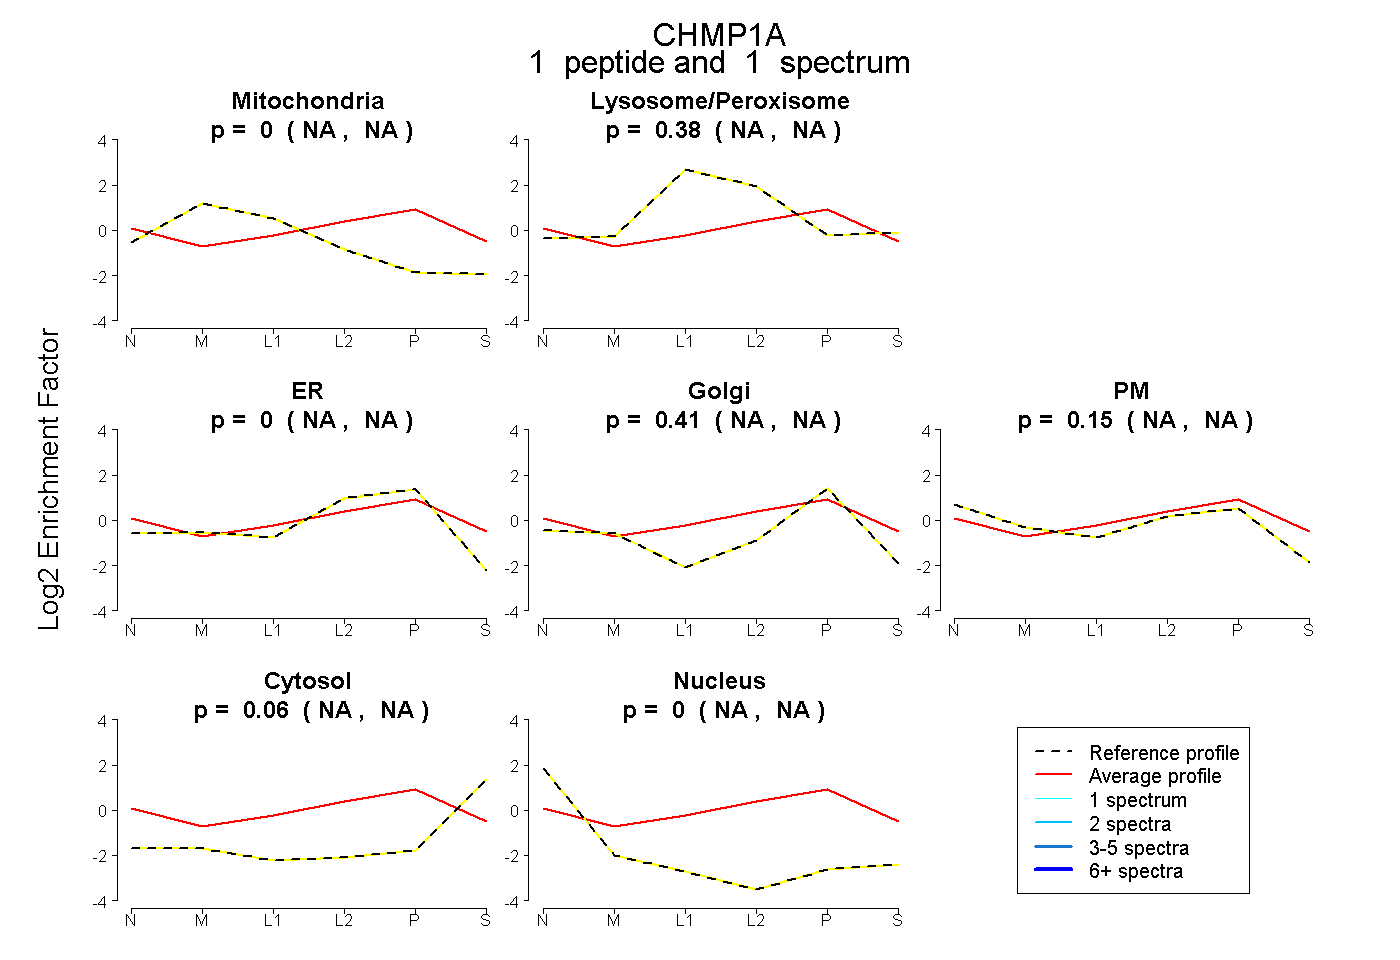
NA | NA
NA | NA
NA | NA
NA | NA
NA | NA
NA | NA
NA | NA
6peptides
spectra
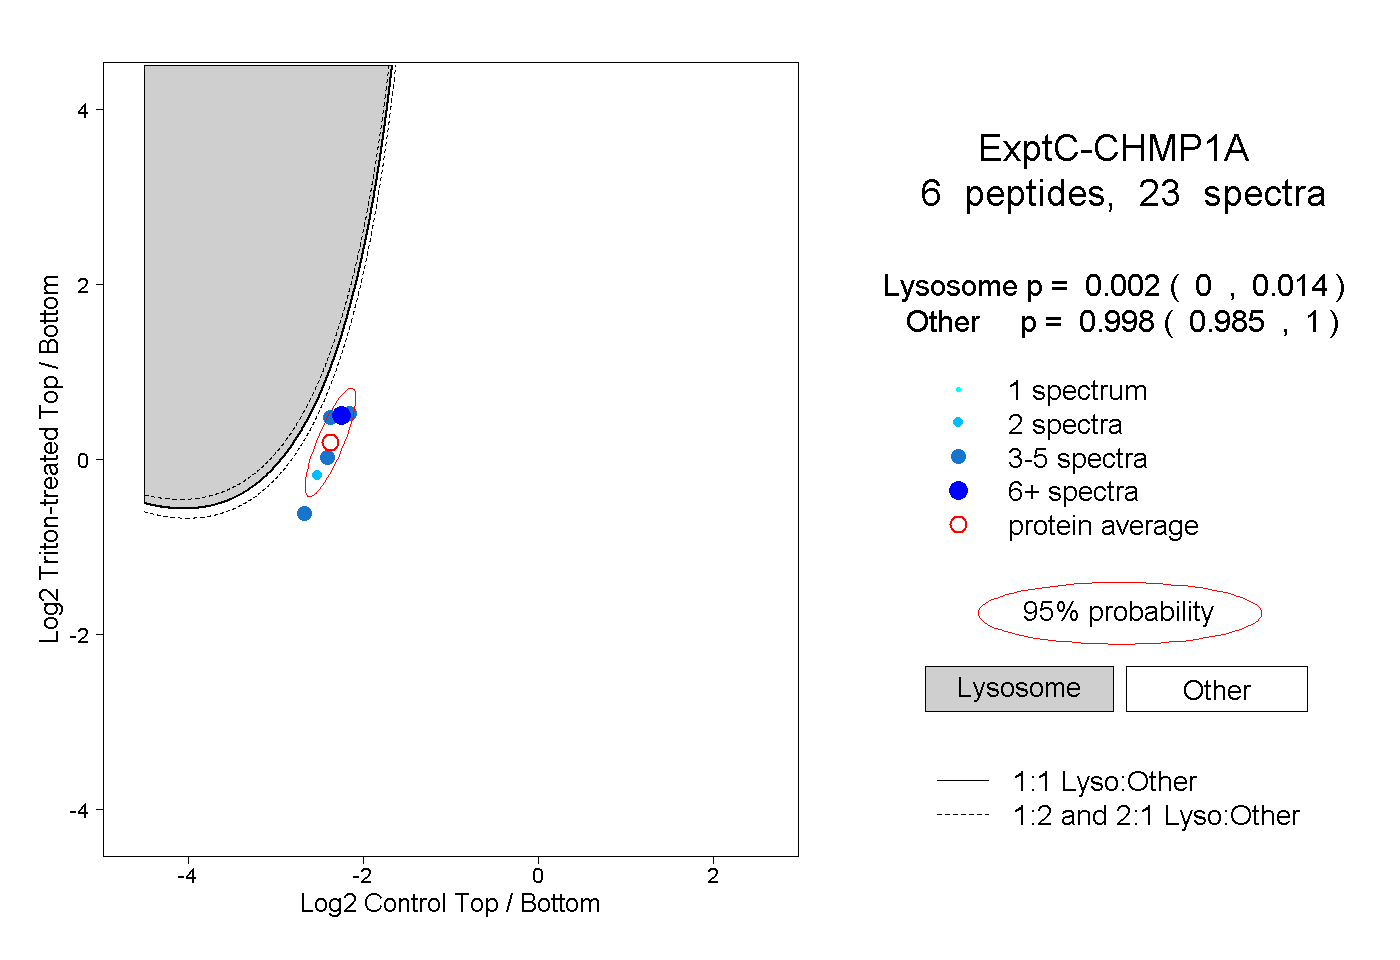
0.000 | 0.014
0.985 | 1.000