CHMP1A
[ENSRNOP00000021475]
Main page
| | | Plot |
Mito |
Lyso |
|
Perox |
ER |
Golgi |
PM |
Cytosol |
Nucleus |
|
| Expt A |
 5
5
peptides |
8
spectra |
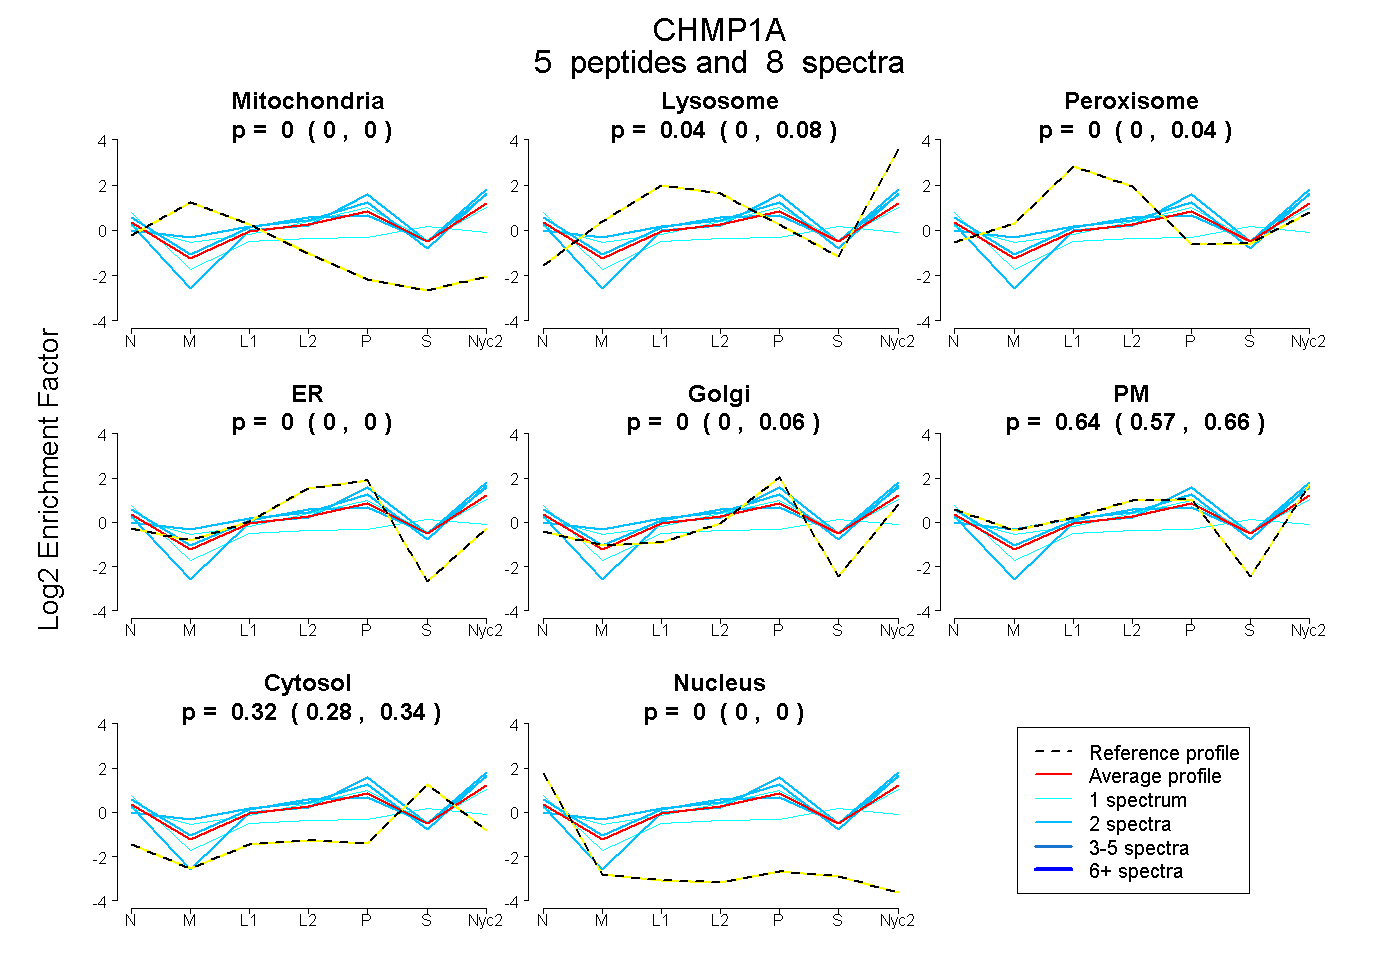 |
0.000
0.000 | 0.000 |
0.043
0.000 | 0.076 |
|
0.000
0.000 | 0.041 |
0.000
0.000 | 0.000 |
0.000
0.000 | 0.059 |
0.641
0.570 | 0.663 |
0.316
0.283 | 0.337 |
0.000
0.000 | 0.000 |
|
| | | Plot |
Mito |
|
Lyso or Perox |
|
ER |
Golgi |
PM |
Cytosol |
Nucleus |
|
| Expt B |
1
peptide |
1
spectrum |
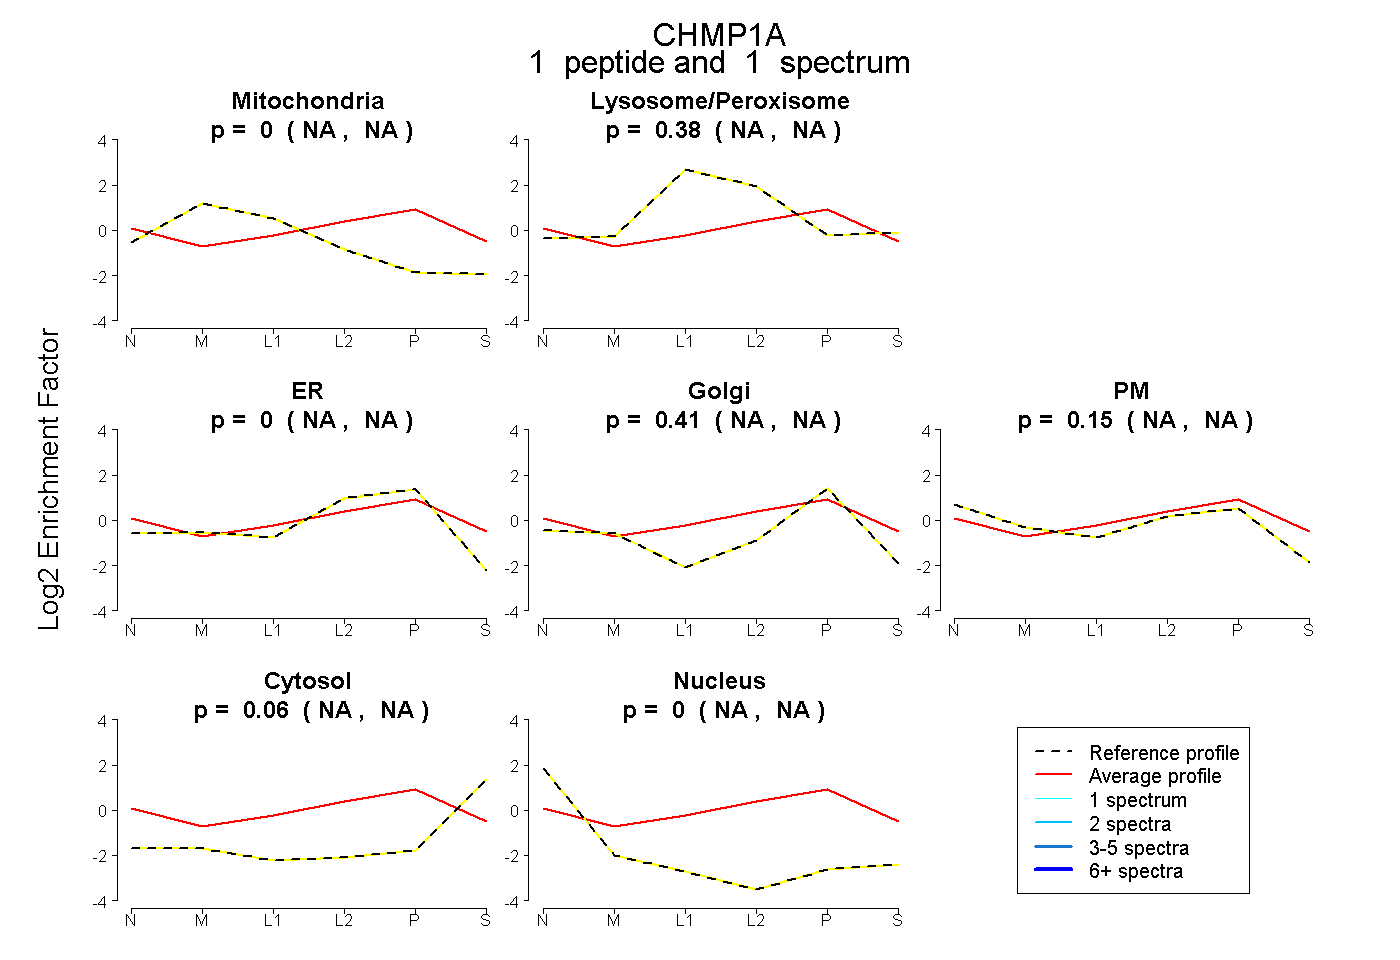 |
0.000
NA | NA |
|
0.378
NA | NA |
|
0.000
NA | NA |
0.414
NA | NA |
0.146
NA | NA |
0.062
NA | NA |
0.000
NA | NA |
|
| | | Plot |
|
Lyso |
|
|
|
|
|
|
|
Other |
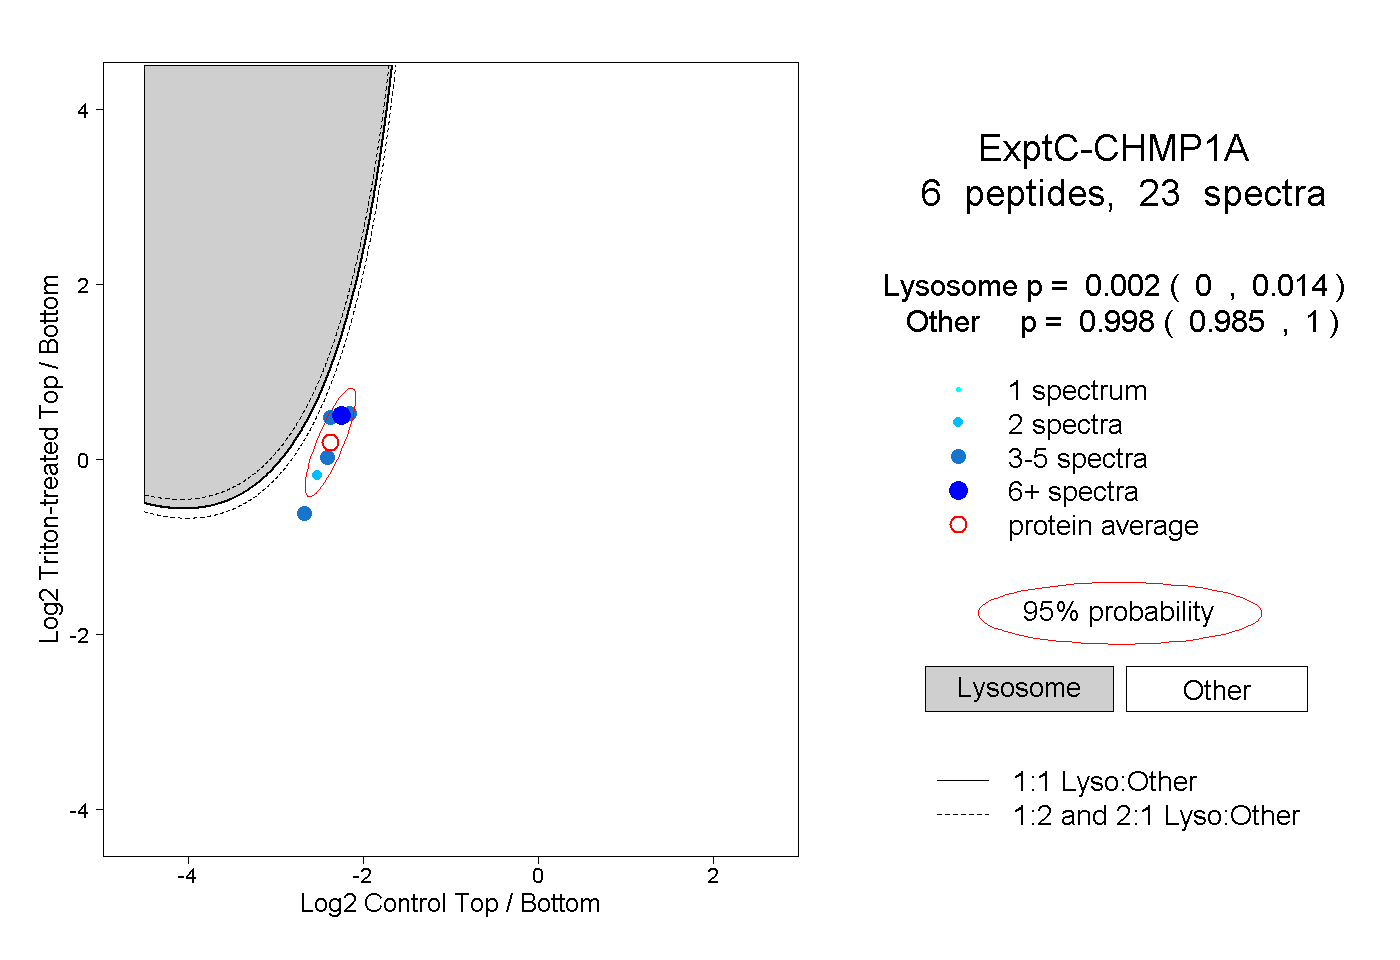
| Expt C |
6
peptides |
23
spectra |
 |
|
0.002
0.000 | 0.014 |
|
|
|
|
|
|
|
0.998
0.985 | 1.000 |
| 3 spectra, VDAVASK |
|
0.000 |
|
|
|
|
|
|
|
1.000 |
| 5 spectra, VYAENAIR |
|
0.001 |
|
|
|
|
|
|
|
0.999 |
| 2 spectra, ALSAMDLQK |
|
0.001 |
|
|
|
|
|
|
|
0.999 |
| 6 spectra, VQTAVTMK |
|
0.002 |
|
|
|
|
|
|
|
0.998 |
| 4 spectra, SQEDQLSR |
|
0.017 |
|
|
|
|
|
|
|
0.983 |
| 3 spectra, NMAQVTK |
|
0.000 |
|
|
|
|
|
|
|
1.000 |