 4
4peptides
spectra
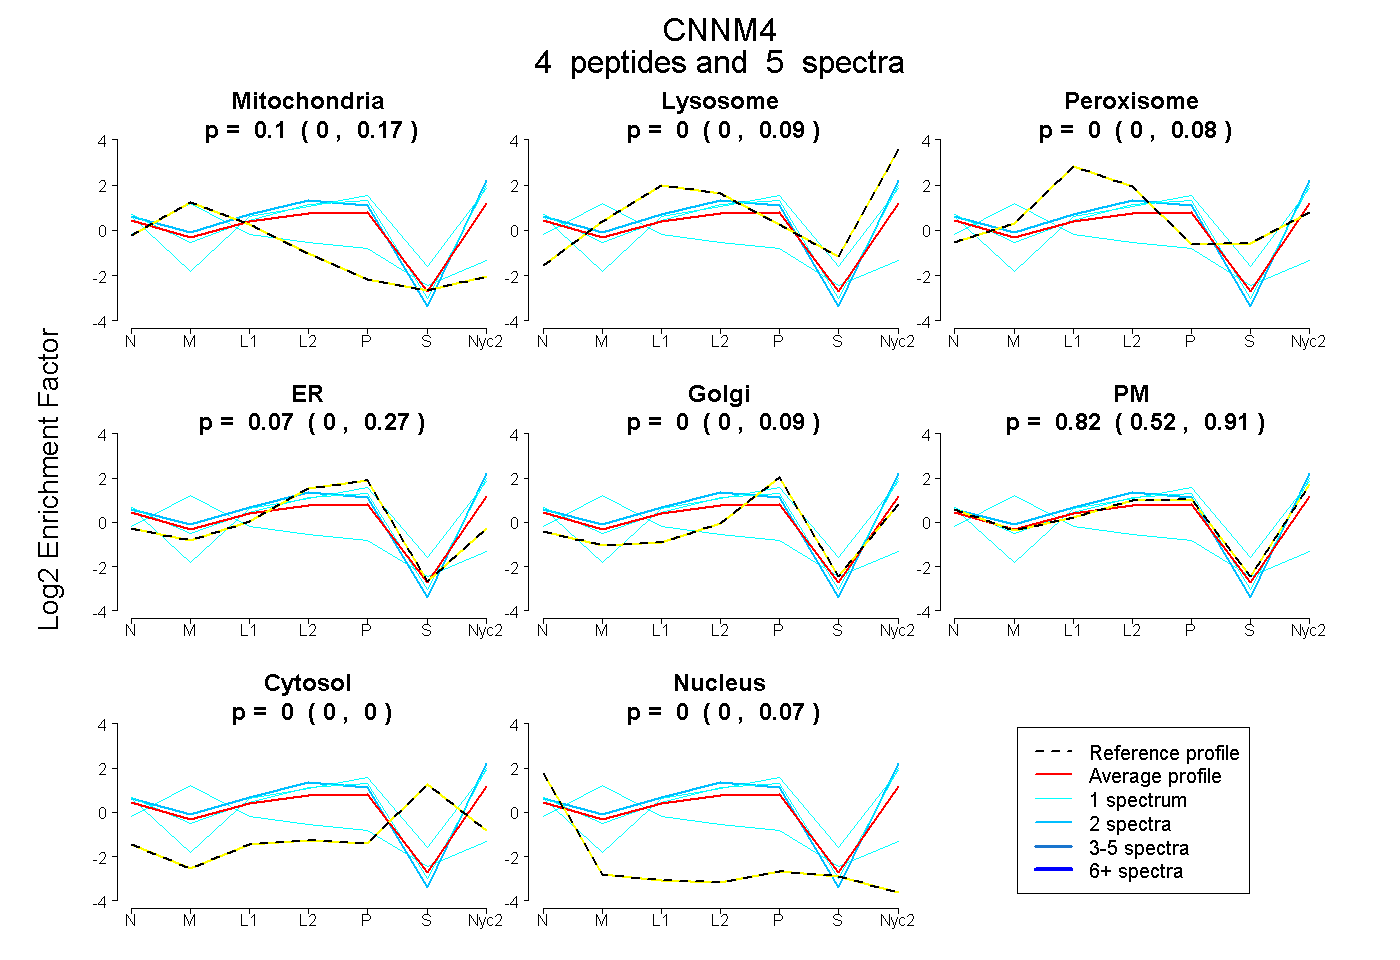
0.000 | 0.170
0.000 | 0.095
0.000 | 0.078
0.000 | 0.270
0.000 | 0.090
0.518 | 0.908
0.000 | 0.000
0.000 | 0.072
1peptide
spectrum
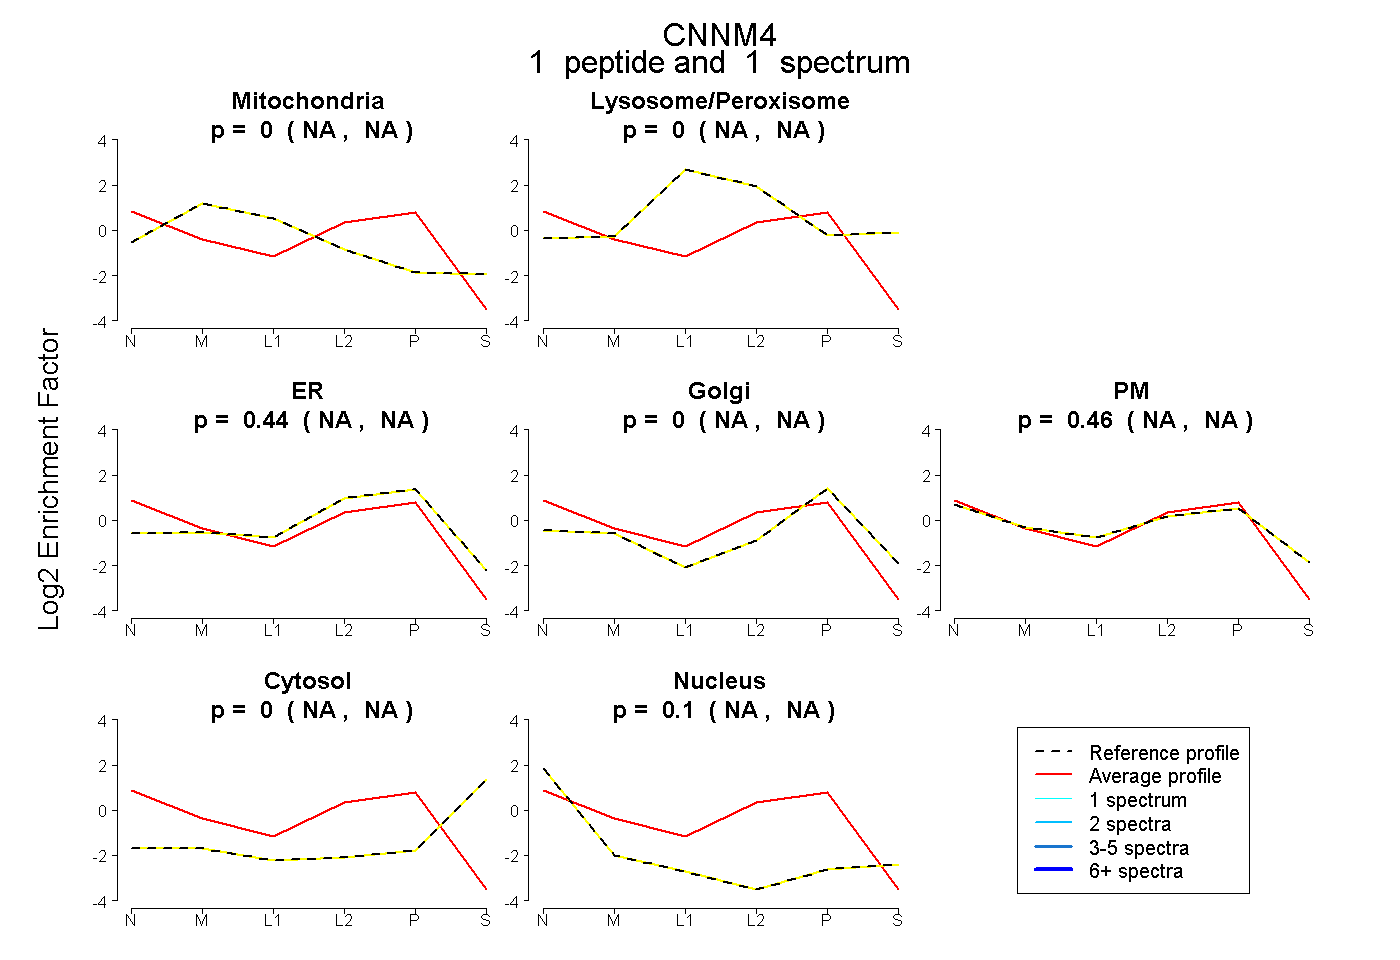
NA | NA
NA | NA
NA | NA
NA | NA
NA | NA
NA | NA
NA | NA
2peptides
spectra
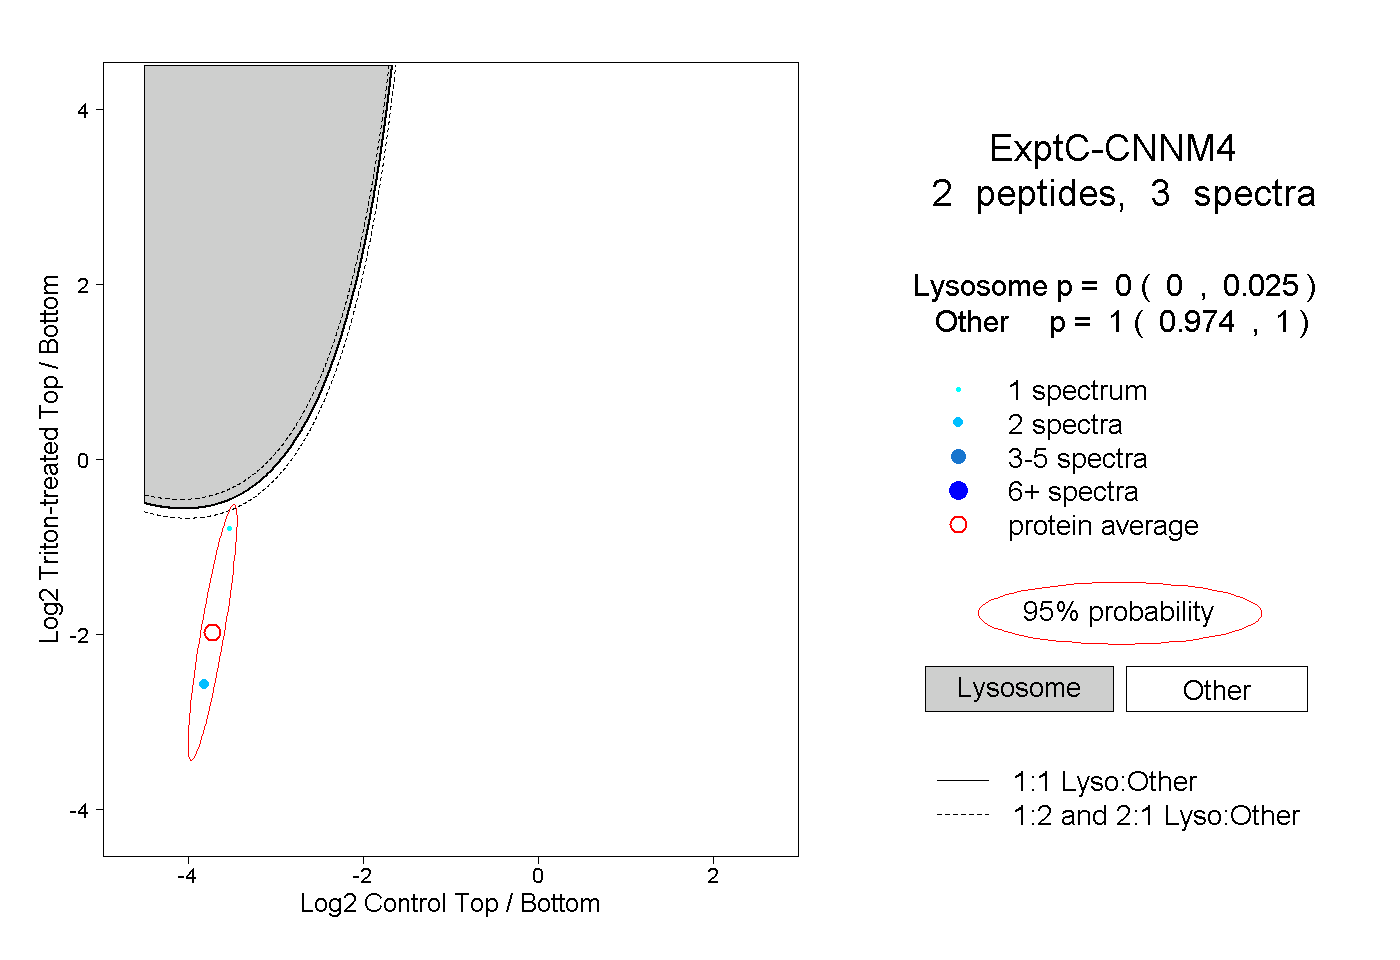
0.000 | 0.025
0.974 | 1.000