 4
4peptides
spectra
0.000 | 0.170
0.000 | 0.095
0.000 | 0.078
0.000 | 0.270
0.000 | 0.090
0.518 | 0.908
0.000 | 0.000
0.000 | 0.072
| Plot | Mito | Lyso | Perox | ER | Golgi | PM | Cytosol | Nucleus | |||||
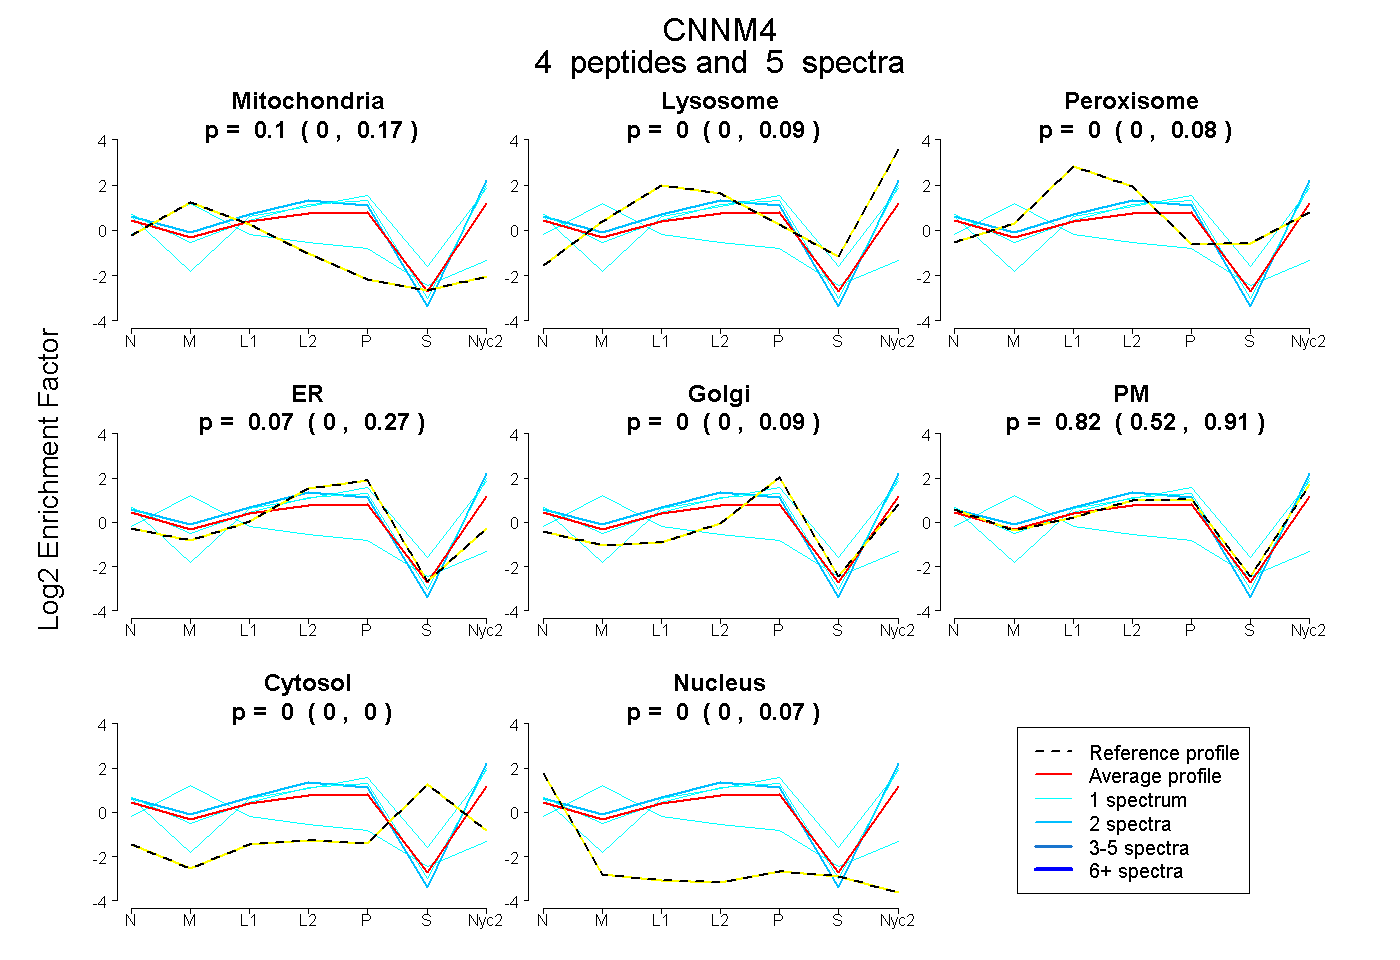
| Expt A |
4 peptides |
5 spectra |
|
0.104 0.000 | 0.170 |
0.000 0.000 | 0.095 |
0.000 0.000 | 0.078 |
0.072 0.000 | 0.270 |
0.000 0.000 | 0.090 |
0.824 0.518 | 0.908 |
0.000 0.000 | 0.000 |
0.000 0.000 | 0.072 |
| 2 spectra, LLDFVLGQEIR | 0.000 | 0.062 | 0.000 | 0.000 | 0.000 | 0.938 | 0.000 | 0.000 | ||
| 1 spectrum, SEILDESDTYTDNR | 0.000 | 0.000 | 0.000 | 0.000 | 0.000 | 1.000 | 0.000 | 0.000 | ||
| 1 spectrum, GNTSGMLVVITK | 0.723 | 0.000 | 0.000 | 0.076 | 0.173 | 0.029 | 0.000 | 0.000 | ||
| 1 spectrum, NLLLHR | 0.000 | 0.061 | 0.000 | 0.044 | 0.041 | 0.780 | 0.074 | 0.000 |
| Plot | Mito | Lyso or Perox | ER | Golgi | PM | Cytosol | Nucleus | ||||||
| Expt B |
1 peptide |
1 spectrum |
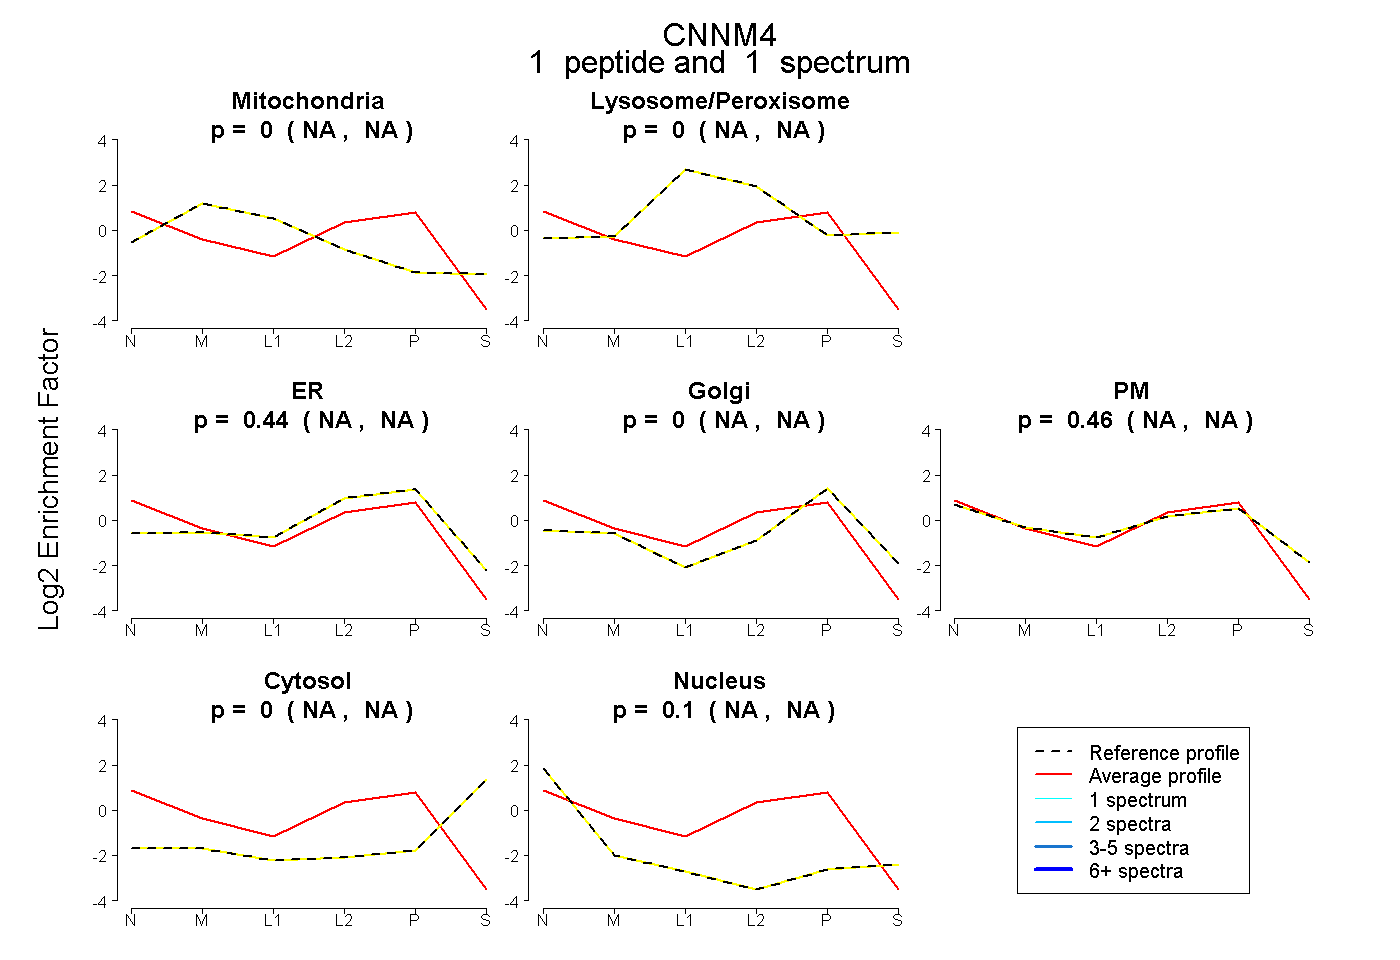 |
0.000 NA | NA |
0.000 NA | NA |
0.438 NA | NA |
0.000 NA | NA |
0.460 NA | NA |
0.000 NA | NA |
0.102 NA | NA |
|||
| Plot | Lyso | Other | |||||||||||
| Expt C |
2 peptides |
3 spectra |
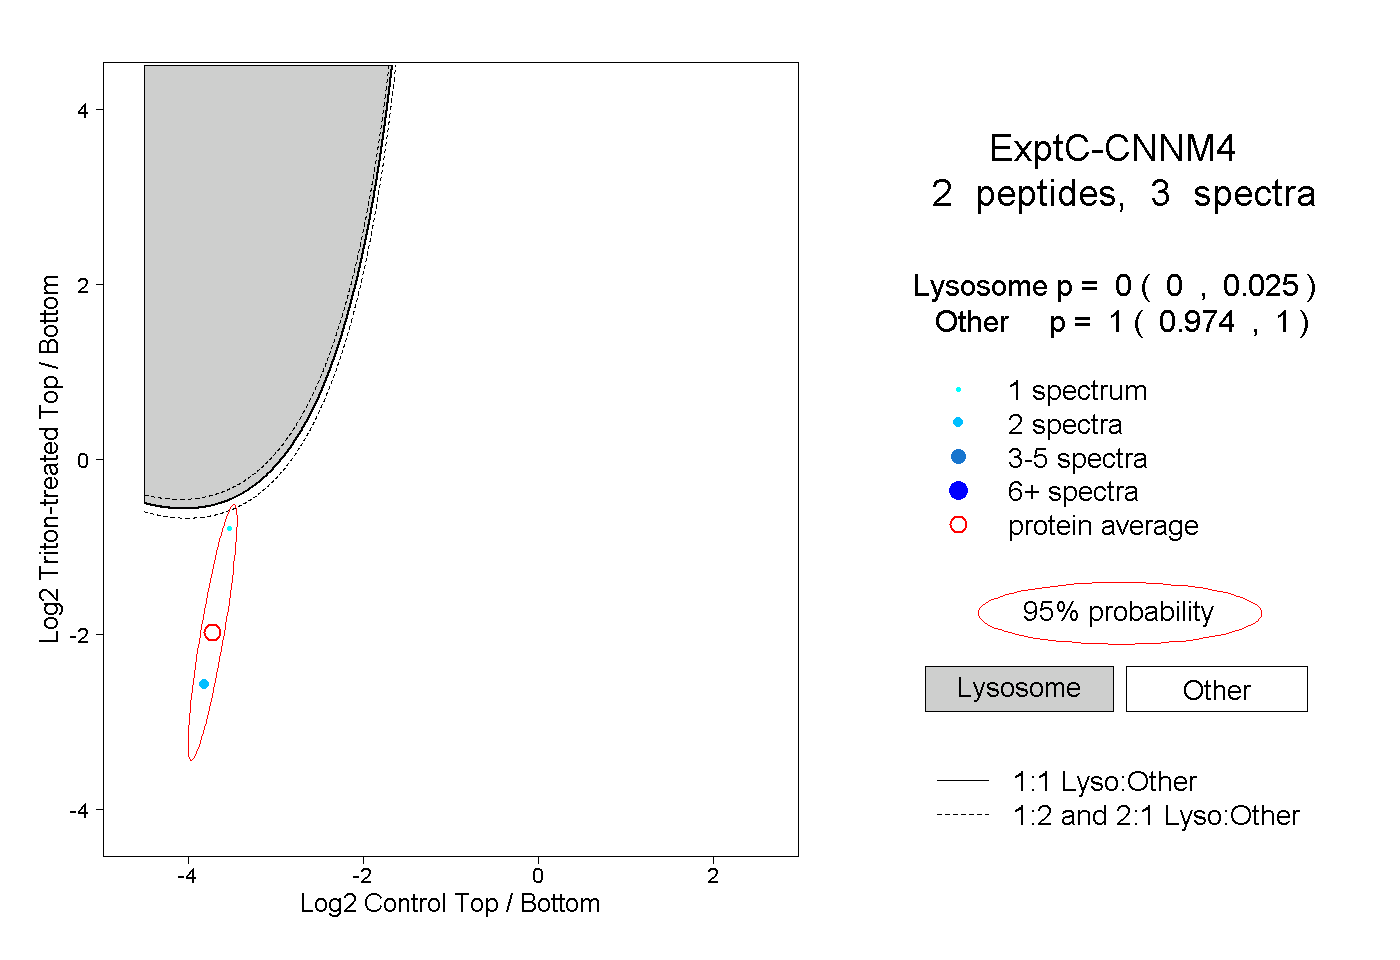 |
0.000 0.000 | 0.025 |
1.000 0.974 | 1.000 |