 6
6peptides
spectra
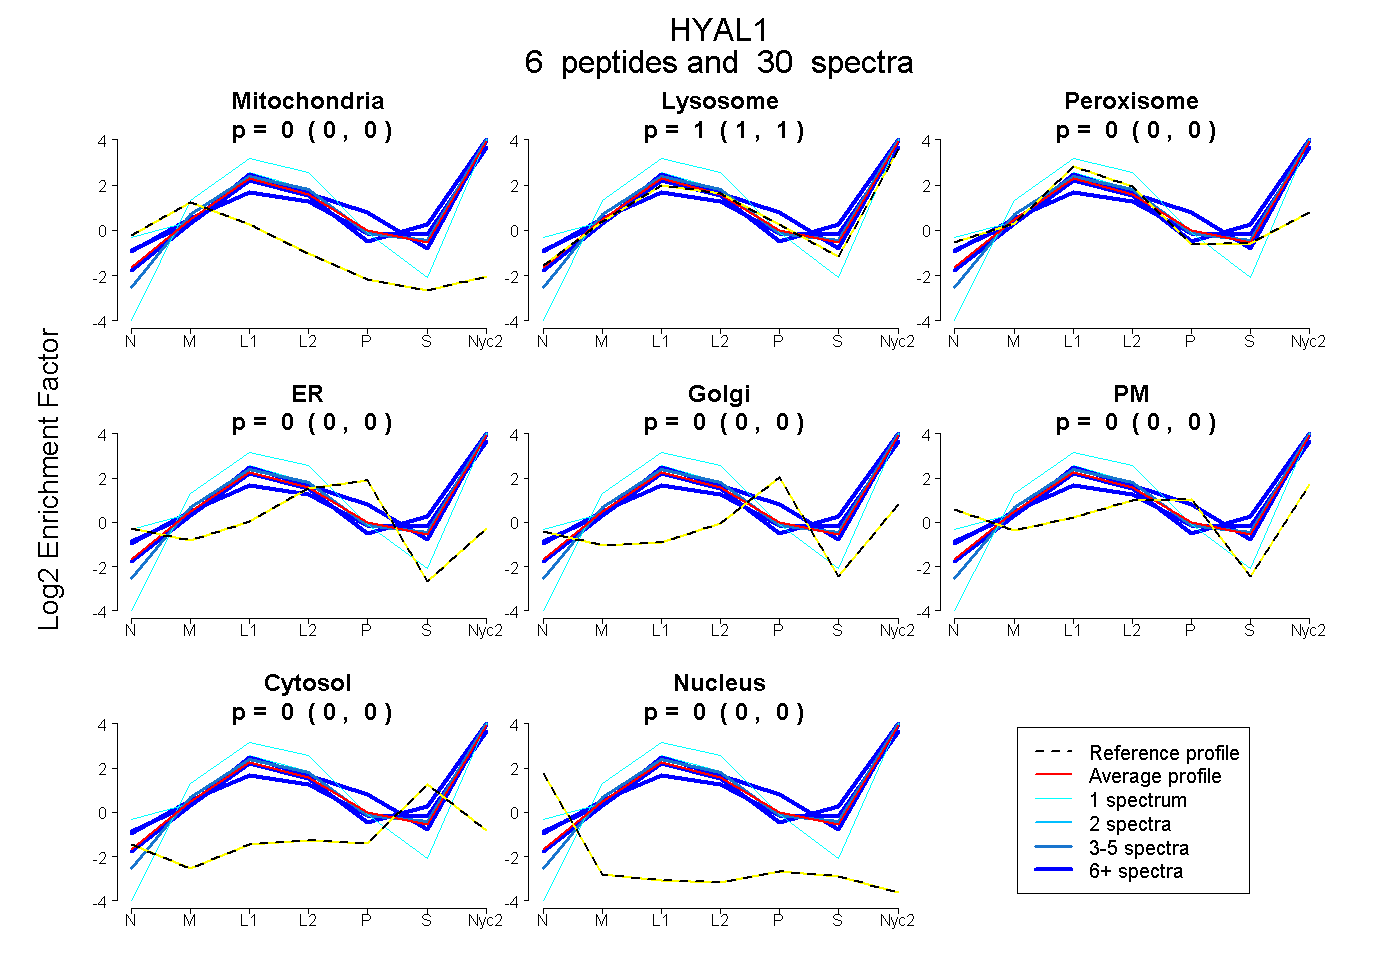
0.000 | 0.000
1.000 | 1.000
0.000 | 0.000
0.000 | 0.000
0.000 | 0.000
0.000 | 0.000
0.000 | 0.000
0.000 | 0.000
2peptides
spectra
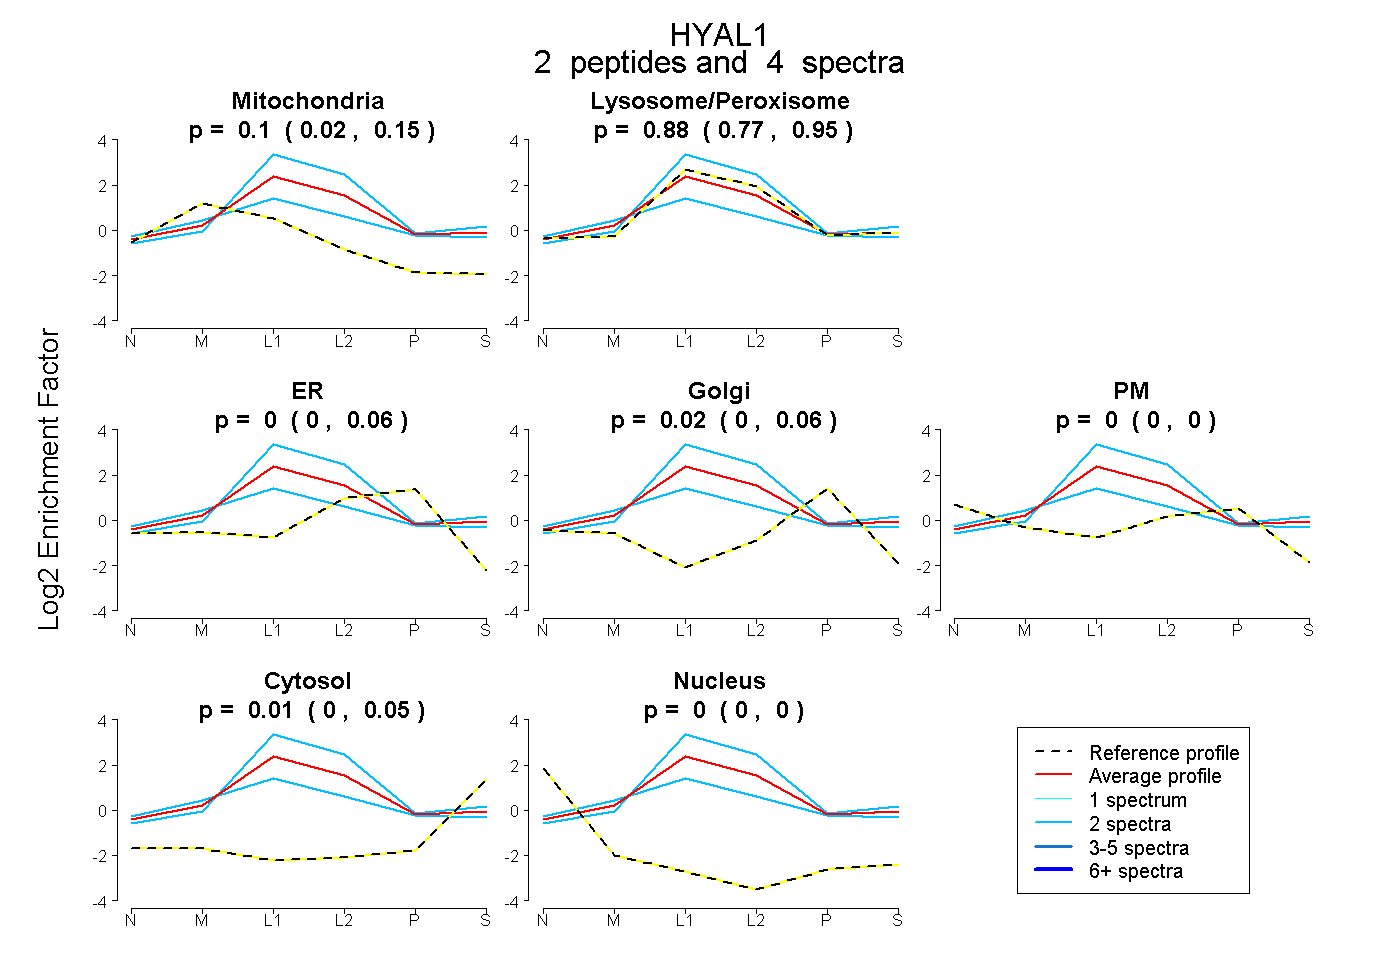
0.019 | 0.150
0.769 | 0.951
0.000 | 0.058
0.000 | 0.065
0.000 | 0.000
0.000 | 0.048
0.000 | 0.000
9peptides
spectra
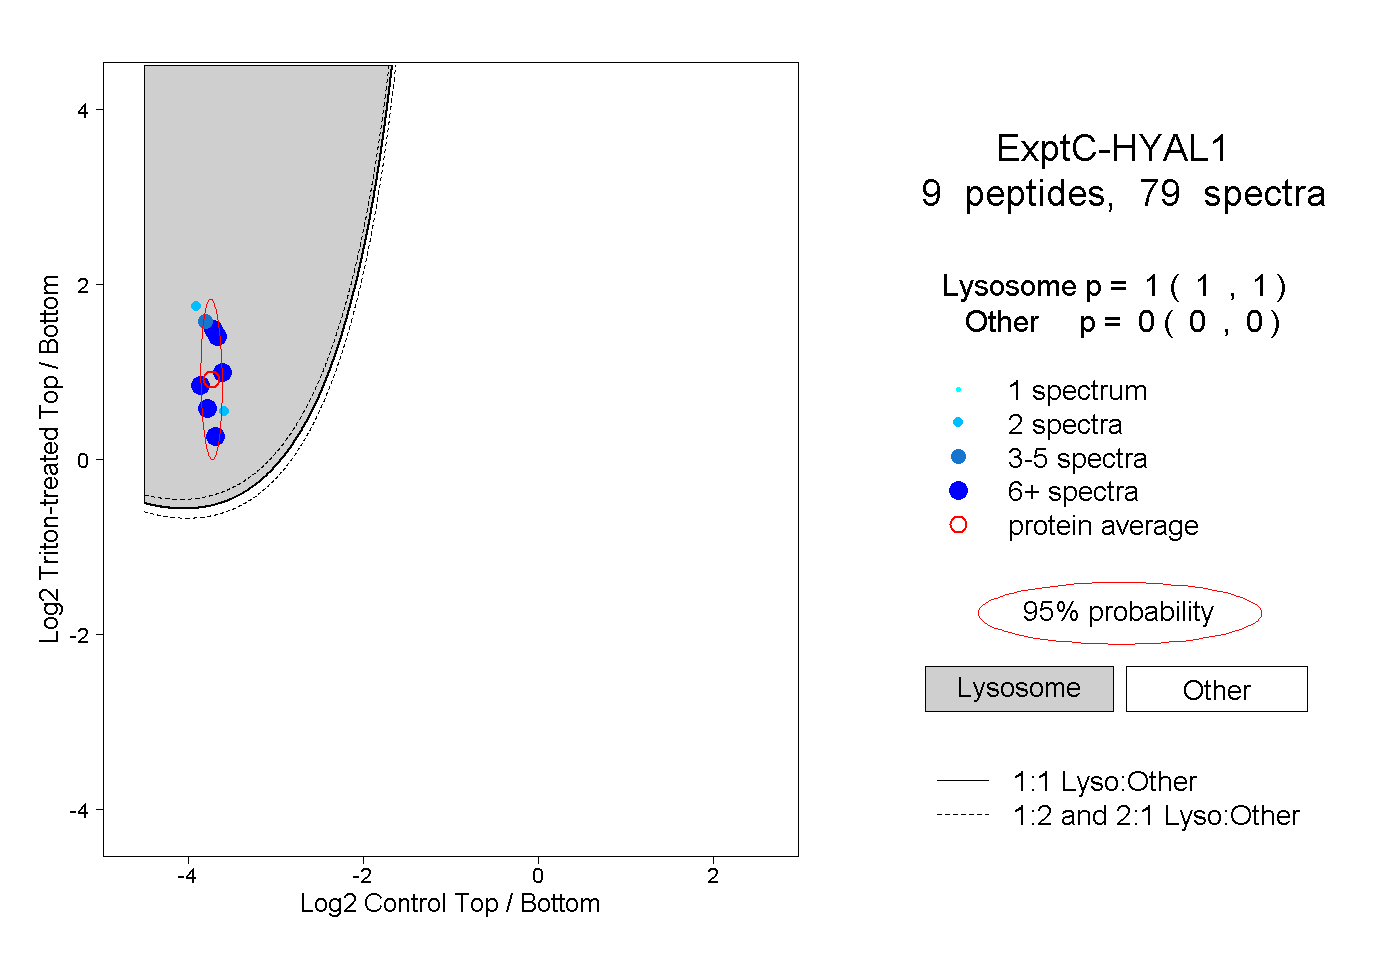
1.000 | 1.000
0.000 | 0.000
2peptides
spectra
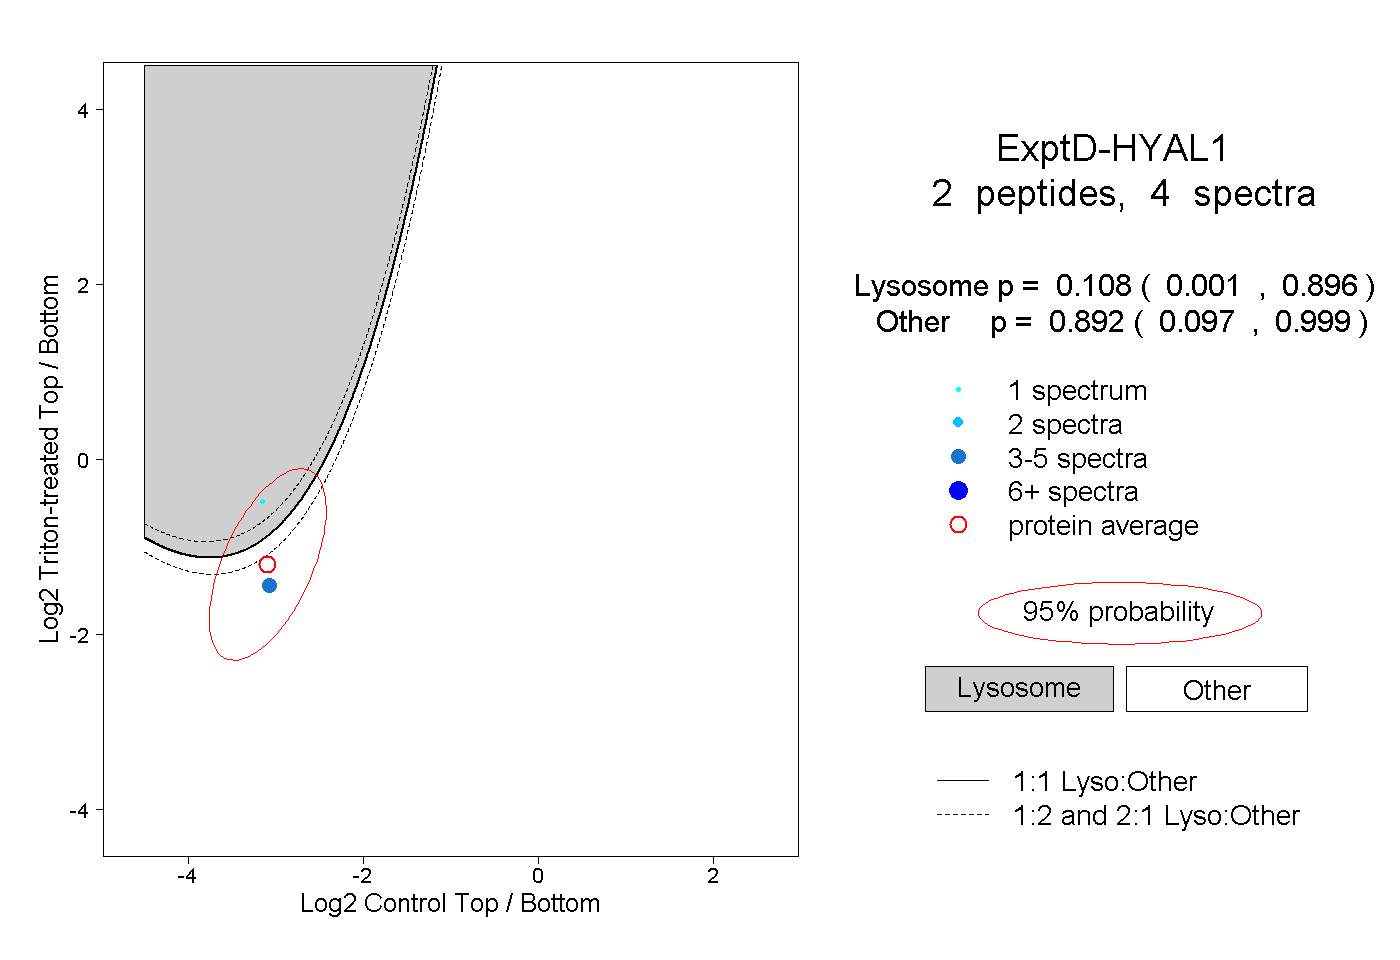
0.001 | 0.896
0.097 | 0.999