 6
6peptides
spectra
0.000 | 0.000
1.000 | 1.000
0.000 | 0.000
0.000 | 0.000
0.000 | 0.000
0.000 | 0.000
0.000 | 0.000
0.000 | 0.000
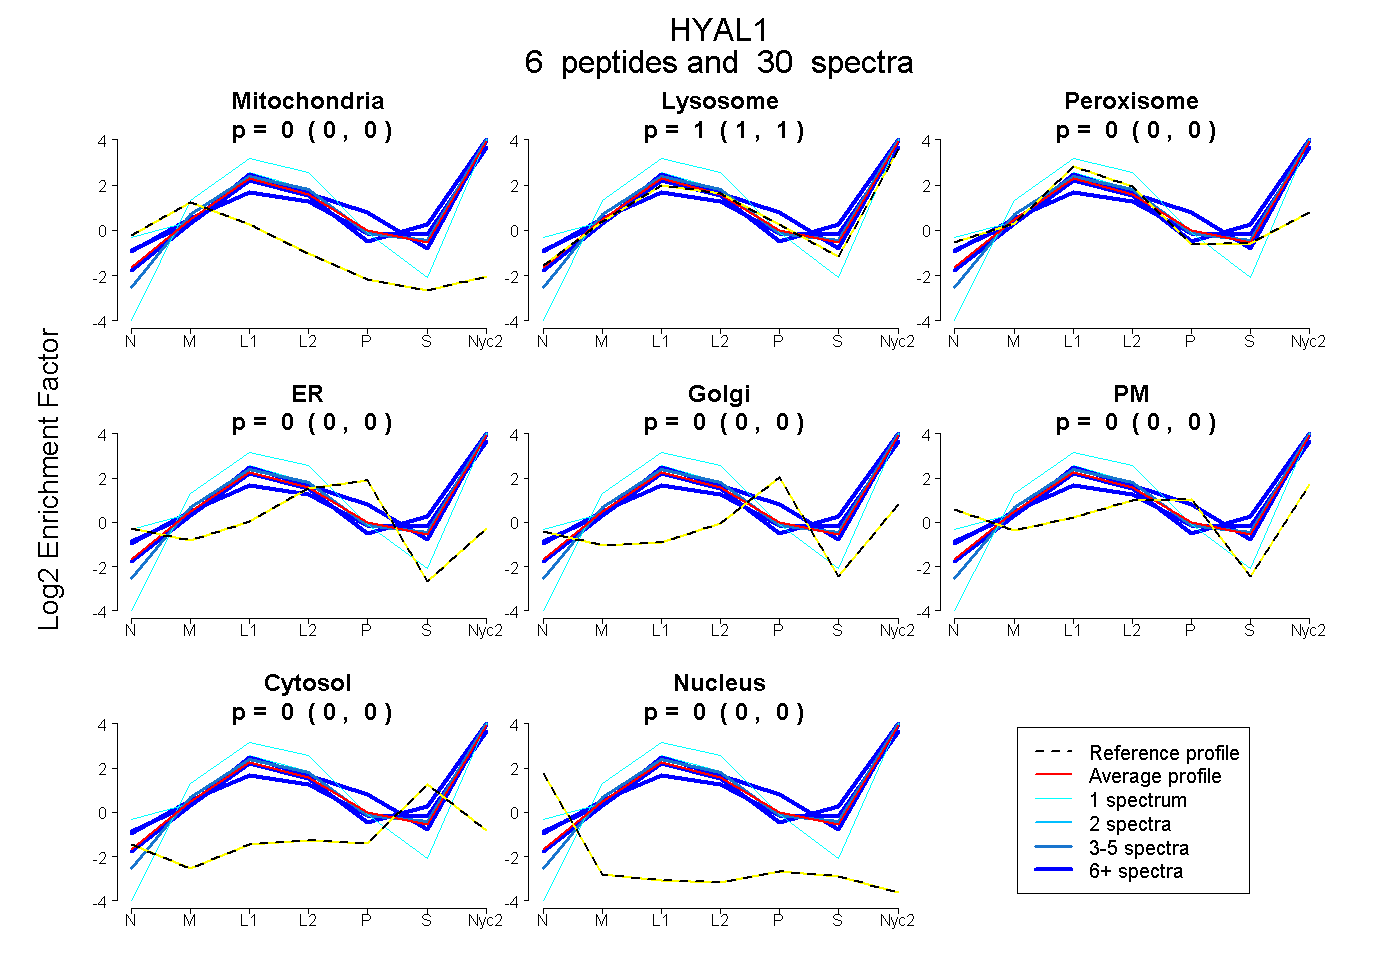
| Plot | Mito | Lyso | Perox | ER | Golgi | PM | Cytosol | Nucleus | |||||
| Expt A |
6 peptides |
30 spectra |
|
0.000 0.000 | 0.000 |
1.000 1.000 | 1.000 |
0.000 0.000 | 0.000 |
0.000 0.000 | 0.000 |
0.000 0.000 | 0.000 |
0.000 0.000 | 0.000 |
0.000 0.000 | 0.000 |
0.000 0.000 | 0.000 |
| 4 spectra, VQEAFR | 0.000 | 1.000 | 0.000 | 0.000 | 0.000 | 0.000 | 0.000 | 0.000 | ||
| 1 spectrum, WAFNWDSK | 0.000 | 1.000 | 0.000 | 0.000 | 0.000 | 0.000 | 0.000 | 0.000 | ||
| 9 spectra, SQMYVR | 0.000 | 1.000 | 0.000 | 0.000 | 0.000 | 0.000 | 0.000 | 0.000 | ||
| 1 spectrum, SMELVR | 0.000 | 0.878 | 0.122 | 0.000 | 0.000 | 0.000 | 0.000 | 0.000 | ||
| 6 spectra, LALVSR | 0.000 | 0.955 | 0.000 | 0.000 | 0.000 | 0.000 | 0.045 | 0.000 | ||
| 9 spectra, DIYQQR | 0.000 | 0.923 | 0.000 | 0.000 | 0.000 | 0.000 | 0.077 | 0.000 |
| Plot | Mito | Lyso or Perox | ER | Golgi | PM | Cytosol | Nucleus | ||||||
| Expt B |
2 peptides |
4 spectra |
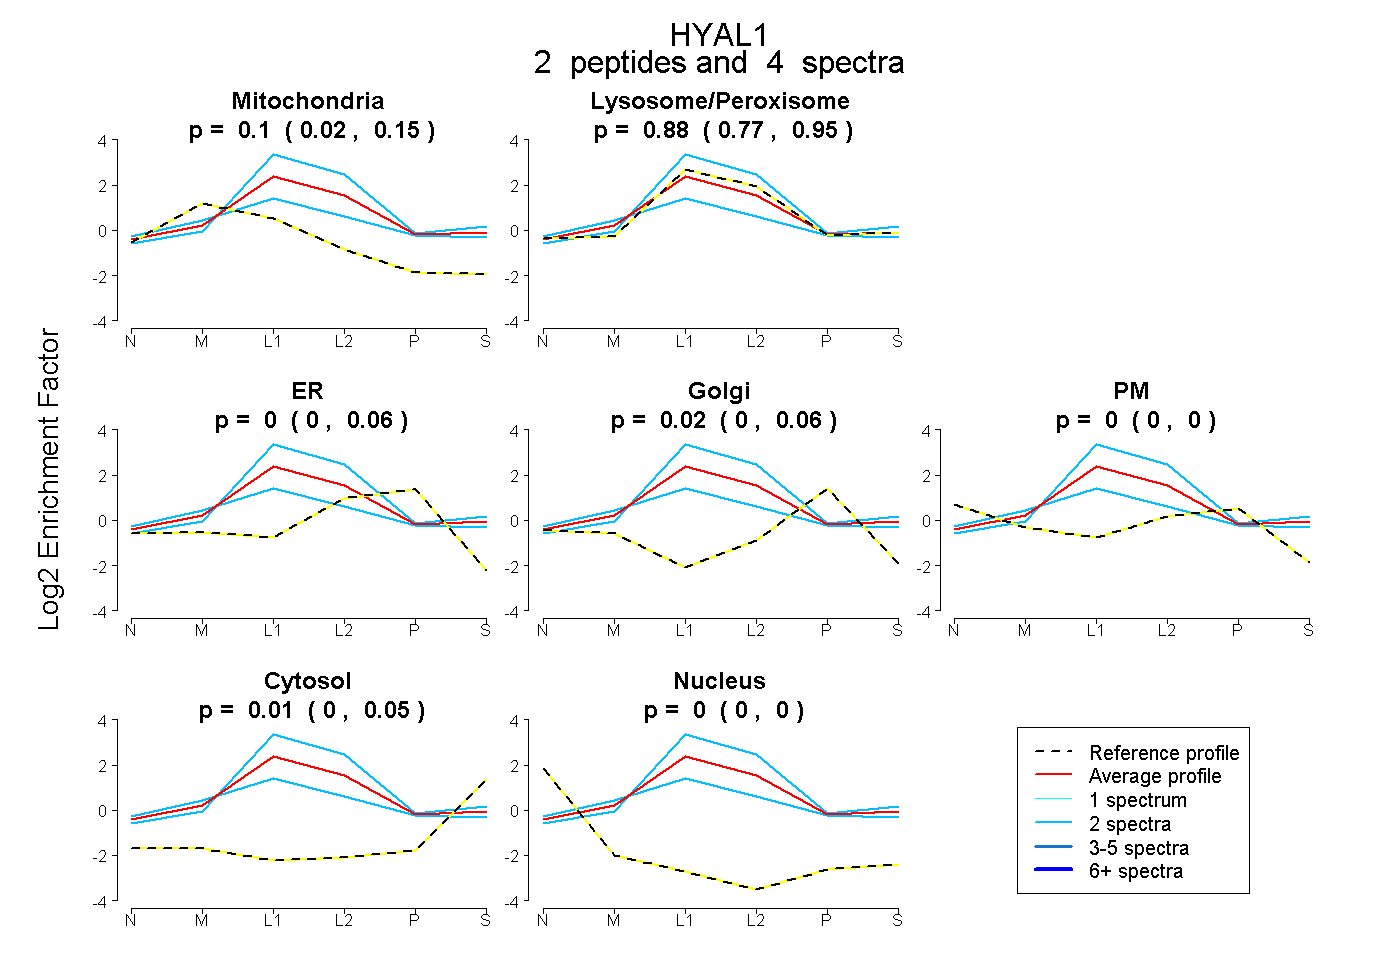 |
0.099 0.019 | 0.150 |
0.878 0.769 | 0.951 |
0.000 0.000 | 0.058 |
0.018 0.000 | 0.065 |
0.000 0.000 | 0.000 |
0.005 0.000 | 0.048 |
0.000 0.000 | 0.000 |
|||
| Plot | Lyso | Other | |||||||||||
| Expt C |
9 peptides |
79 spectra |
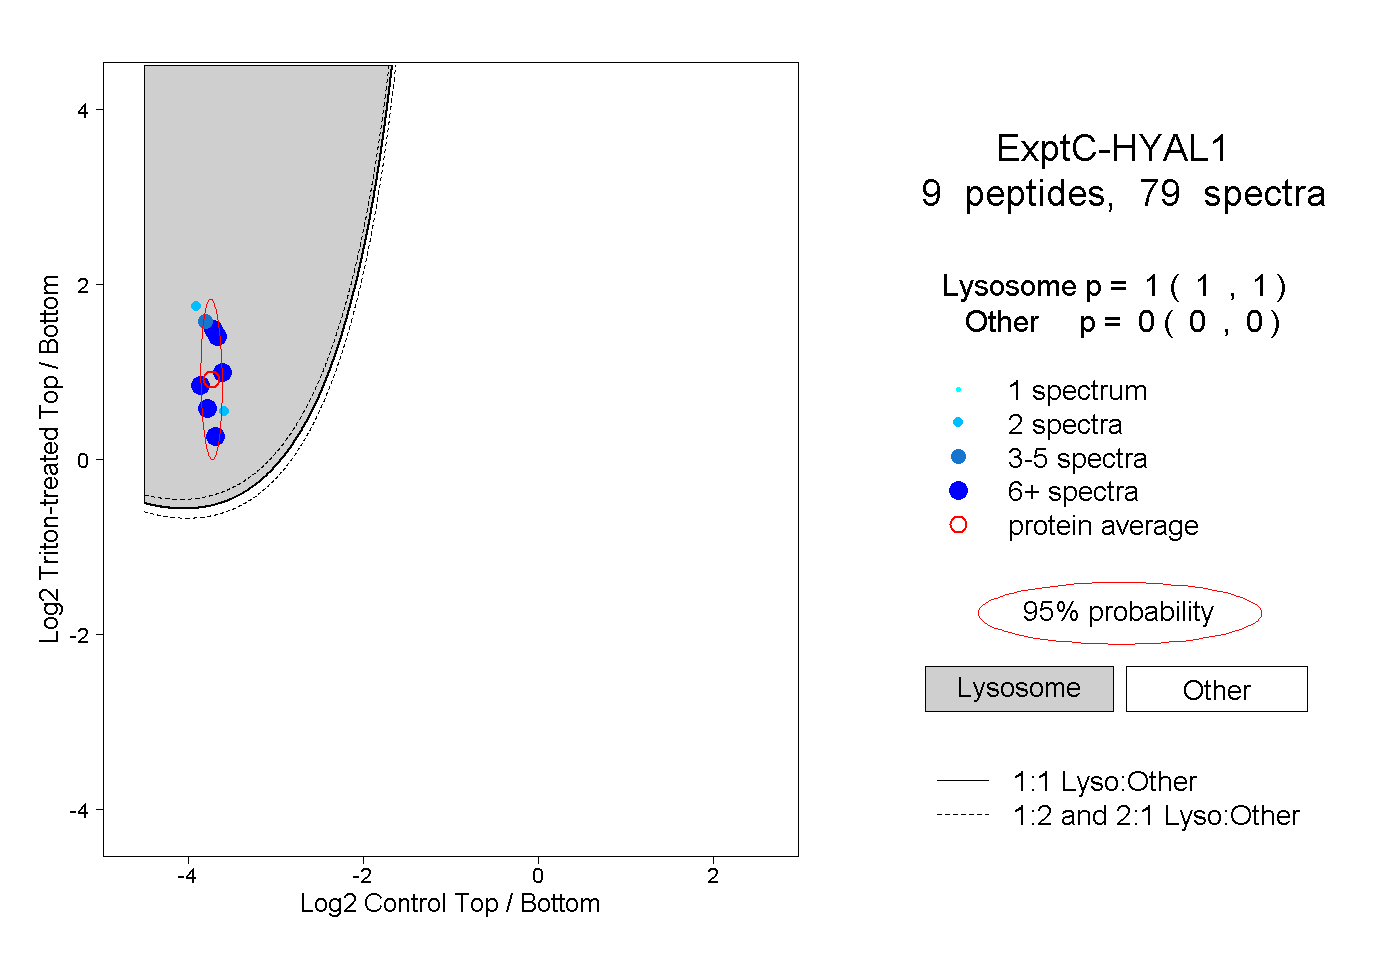 |
1.000 1.000 | 1.000 |
0.000 0.000 | 0.000 |
||||||||
| Plot | Lyso | Other | |||||||||||
| Expt D |
2 peptides |
4 spectra |
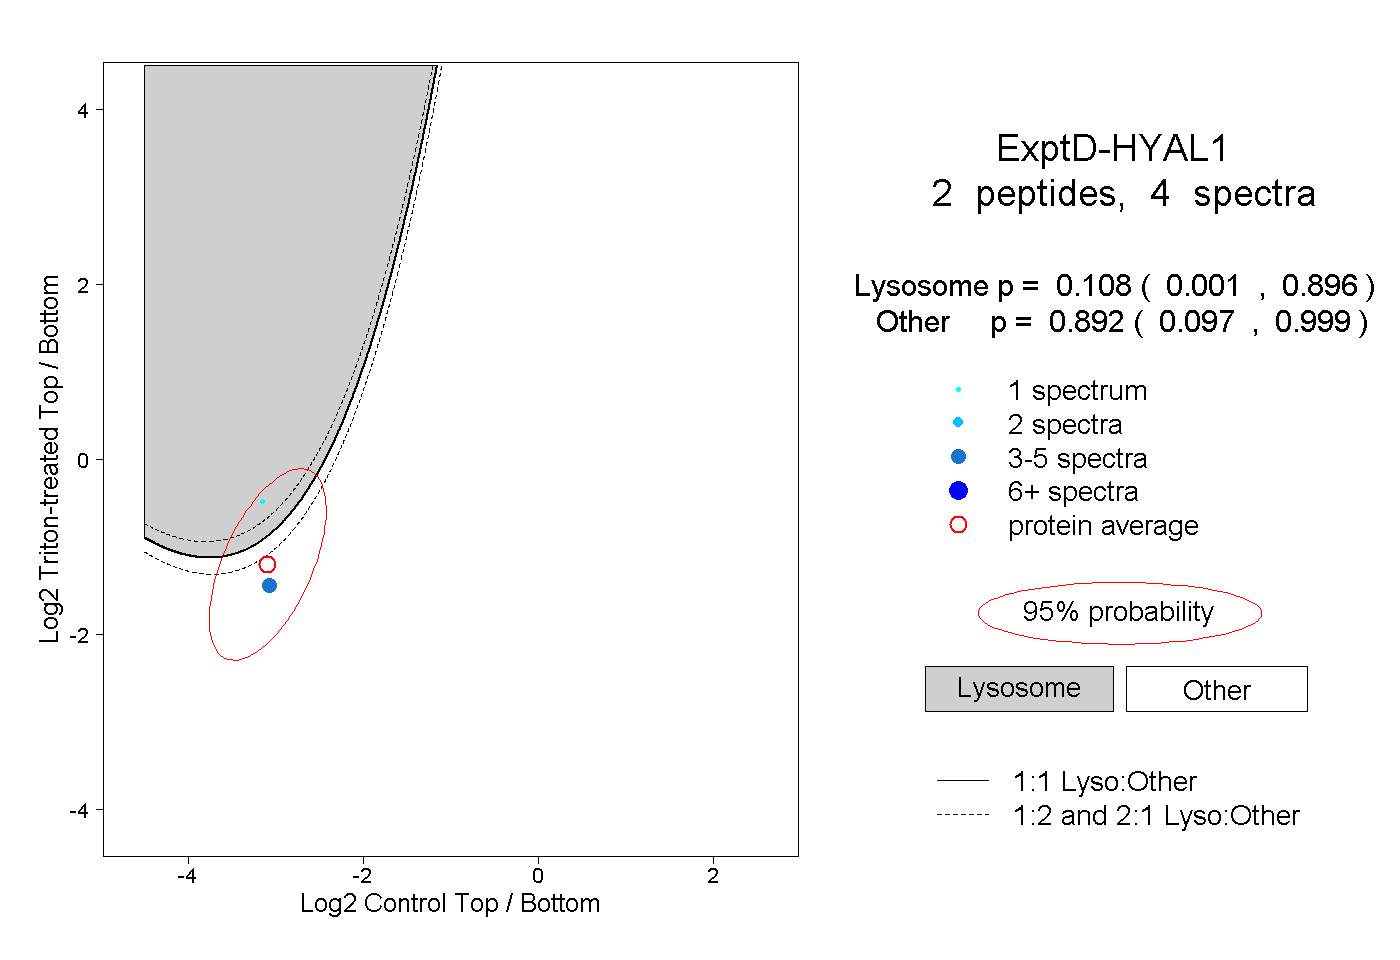 |
0.108 0.001 | 0.896 |
0.892 0.097 | 0.999 |