 26
26peptides
spectra
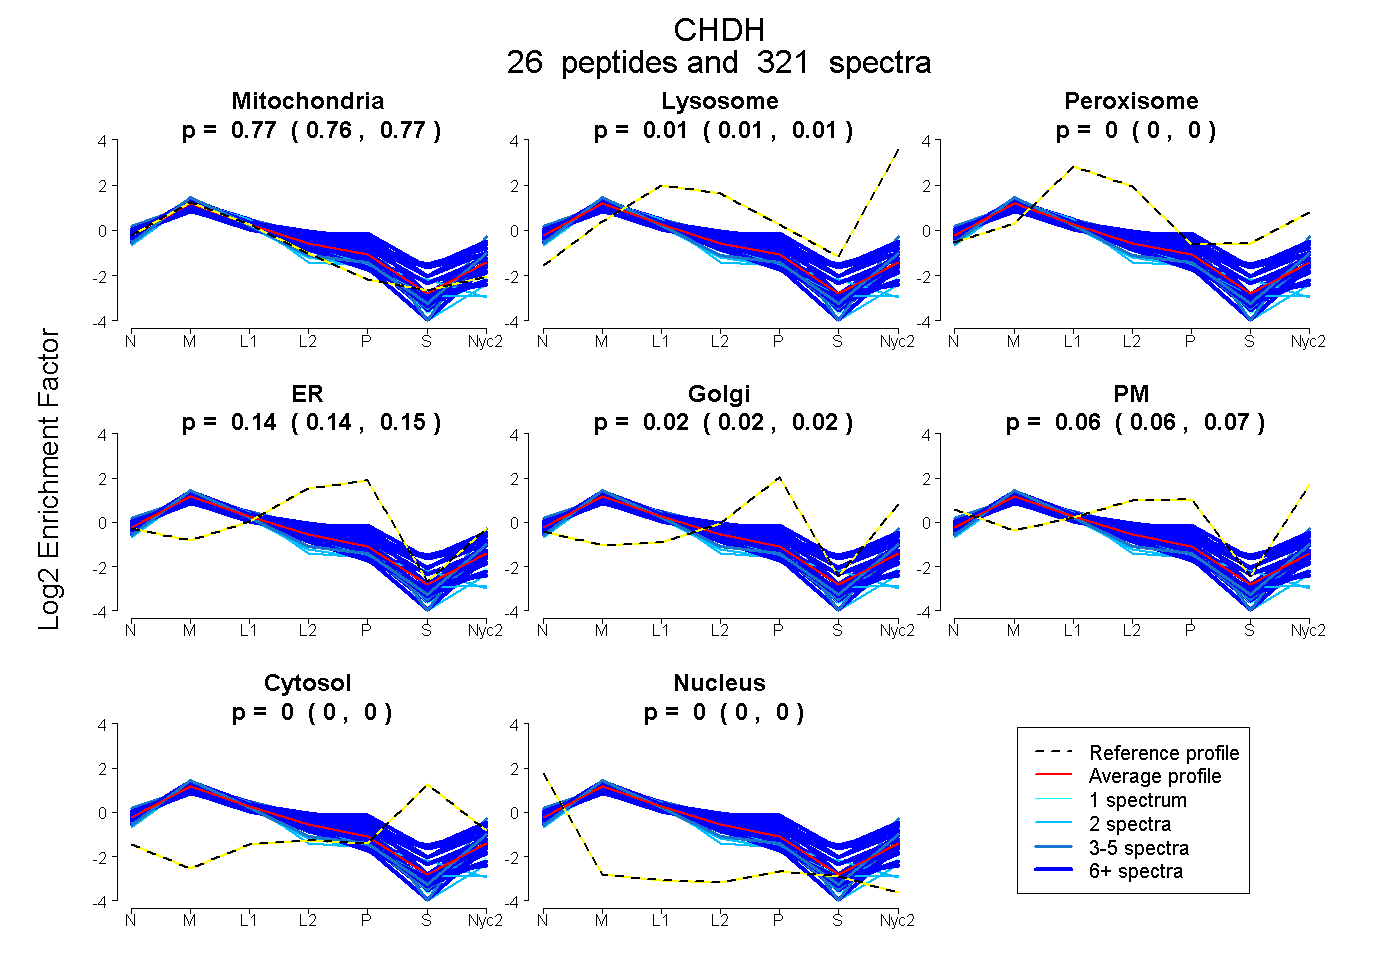
0.764 | 0.768
0.008 | 0.012
0.000 | 0.000
0.138 | 0.147
0.015 | 0.022
0.056 | 0.066
0.000 | 0.000
0.000 | 0.000
21peptides
spectra
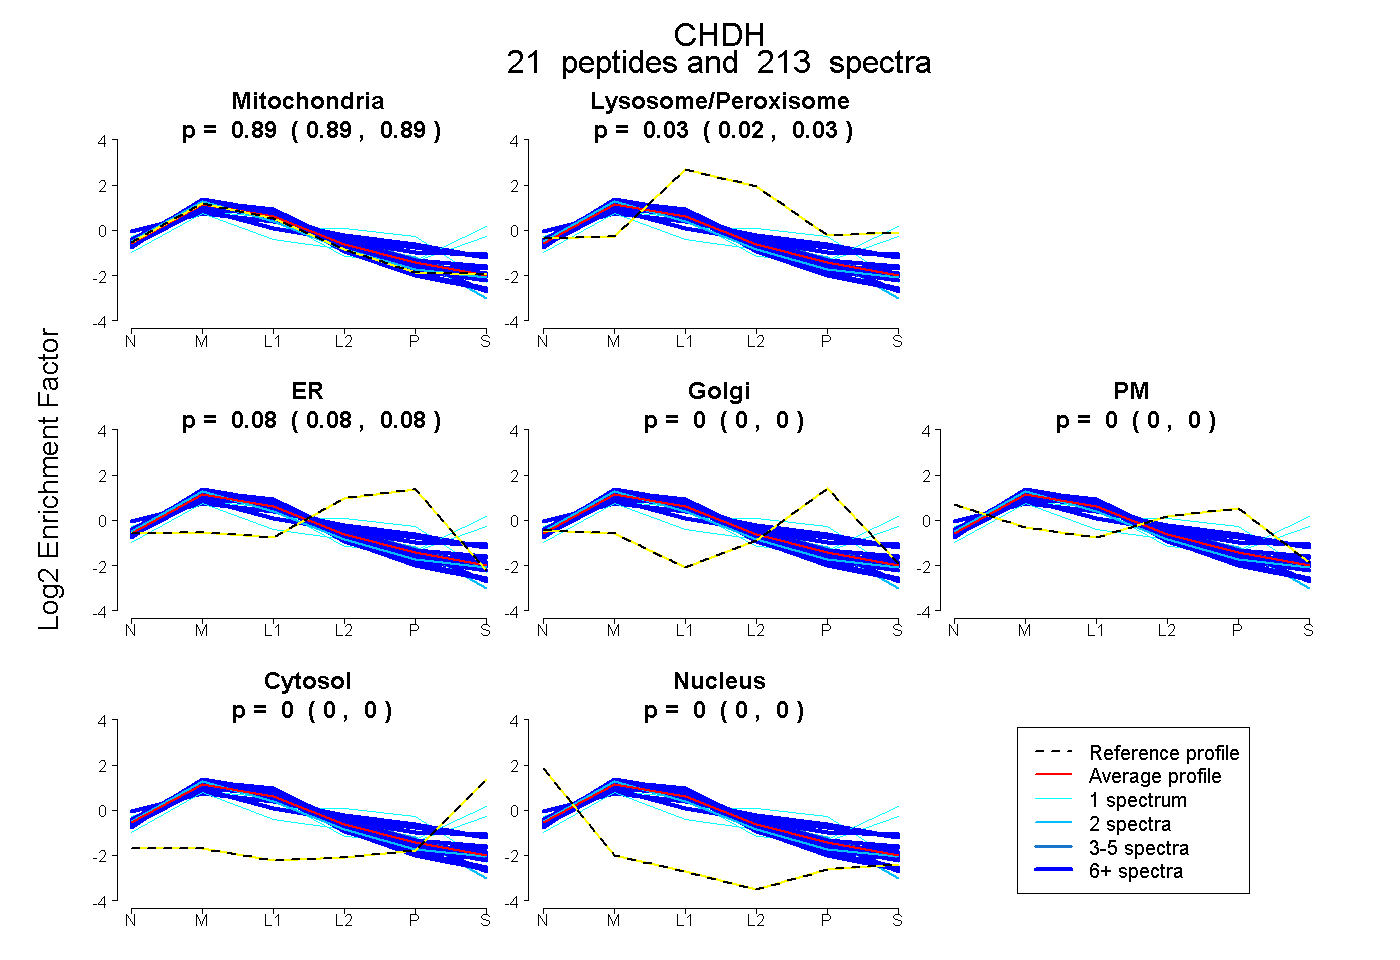
0.890 | 0.895
0.023 | 0.028
0.079 | 0.084
0.000 | 0.000
0.000 | 0.000
0.000 | 0.000
0.000 | 0.000
29peptides
spectra
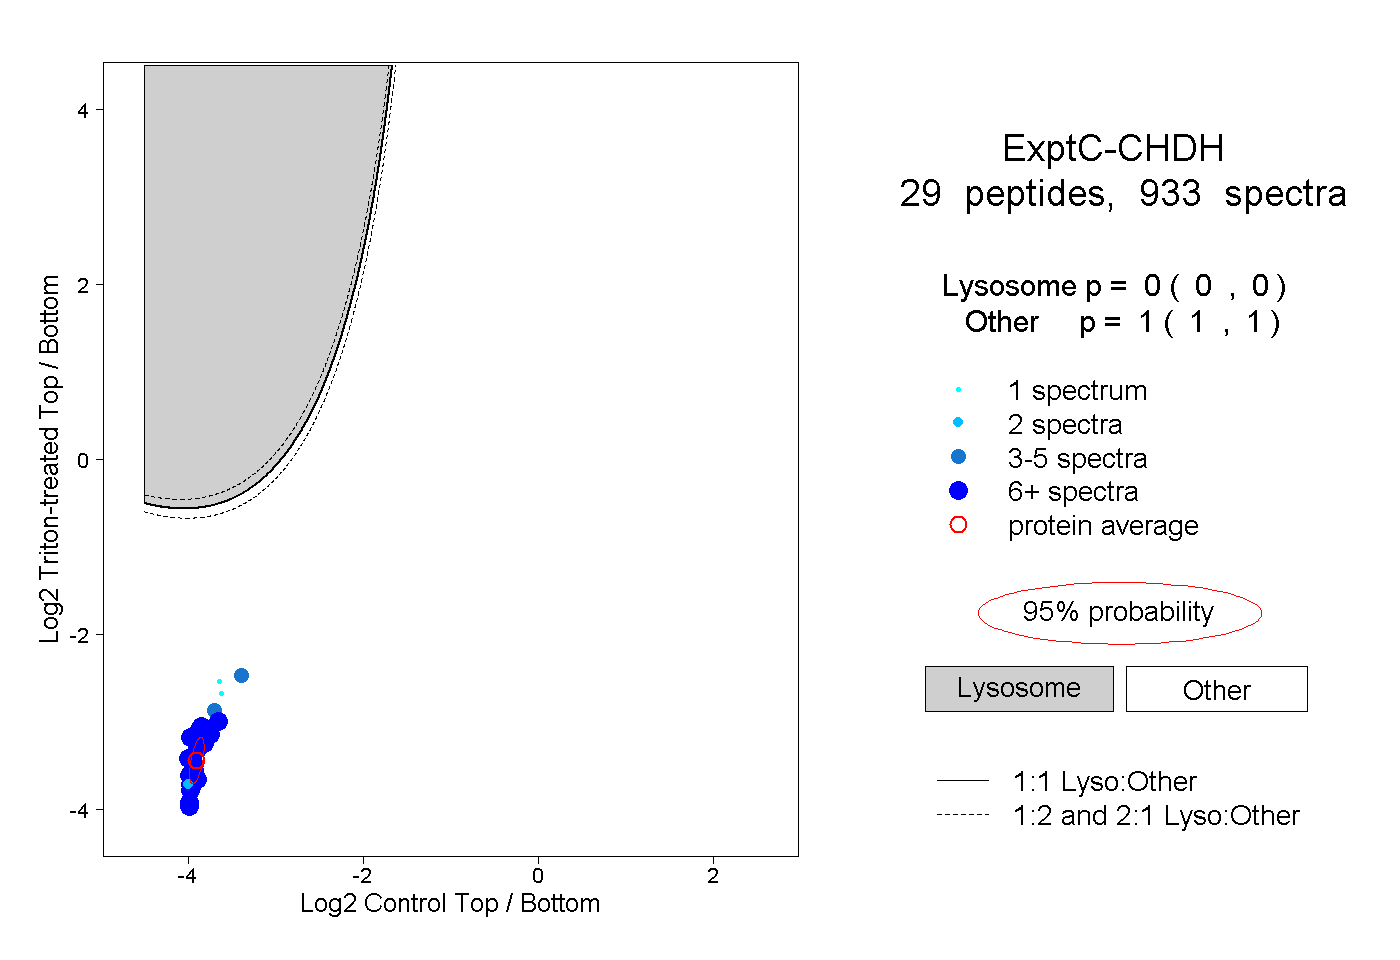
0.000 | 0.000
1.000 | 1.000
15peptides
spectra
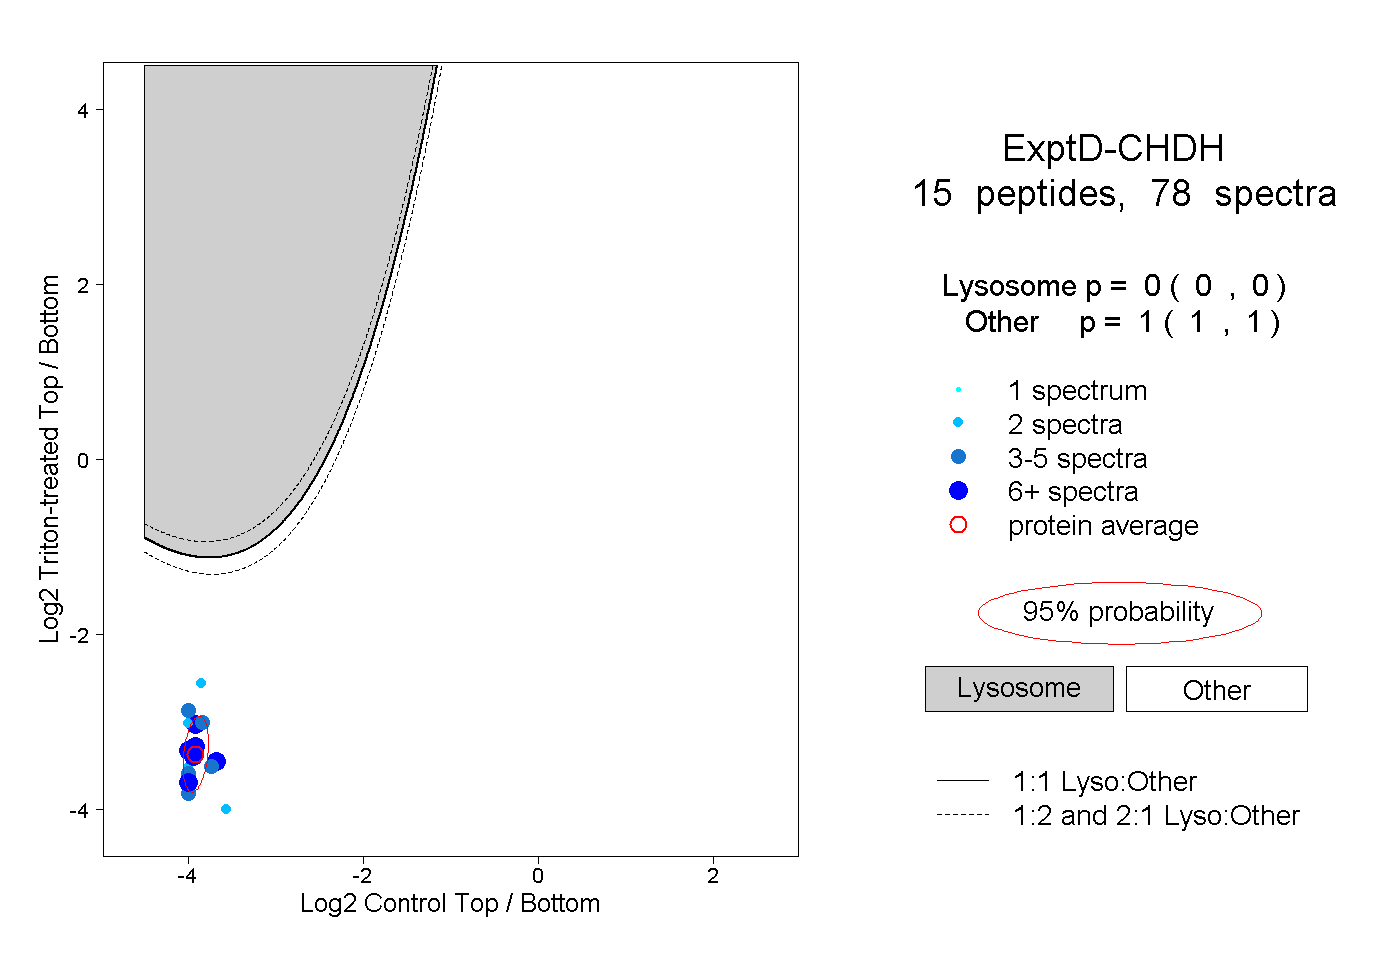
0.000 | 0.000
1.000 | 1.000