 10
10peptides
spectra
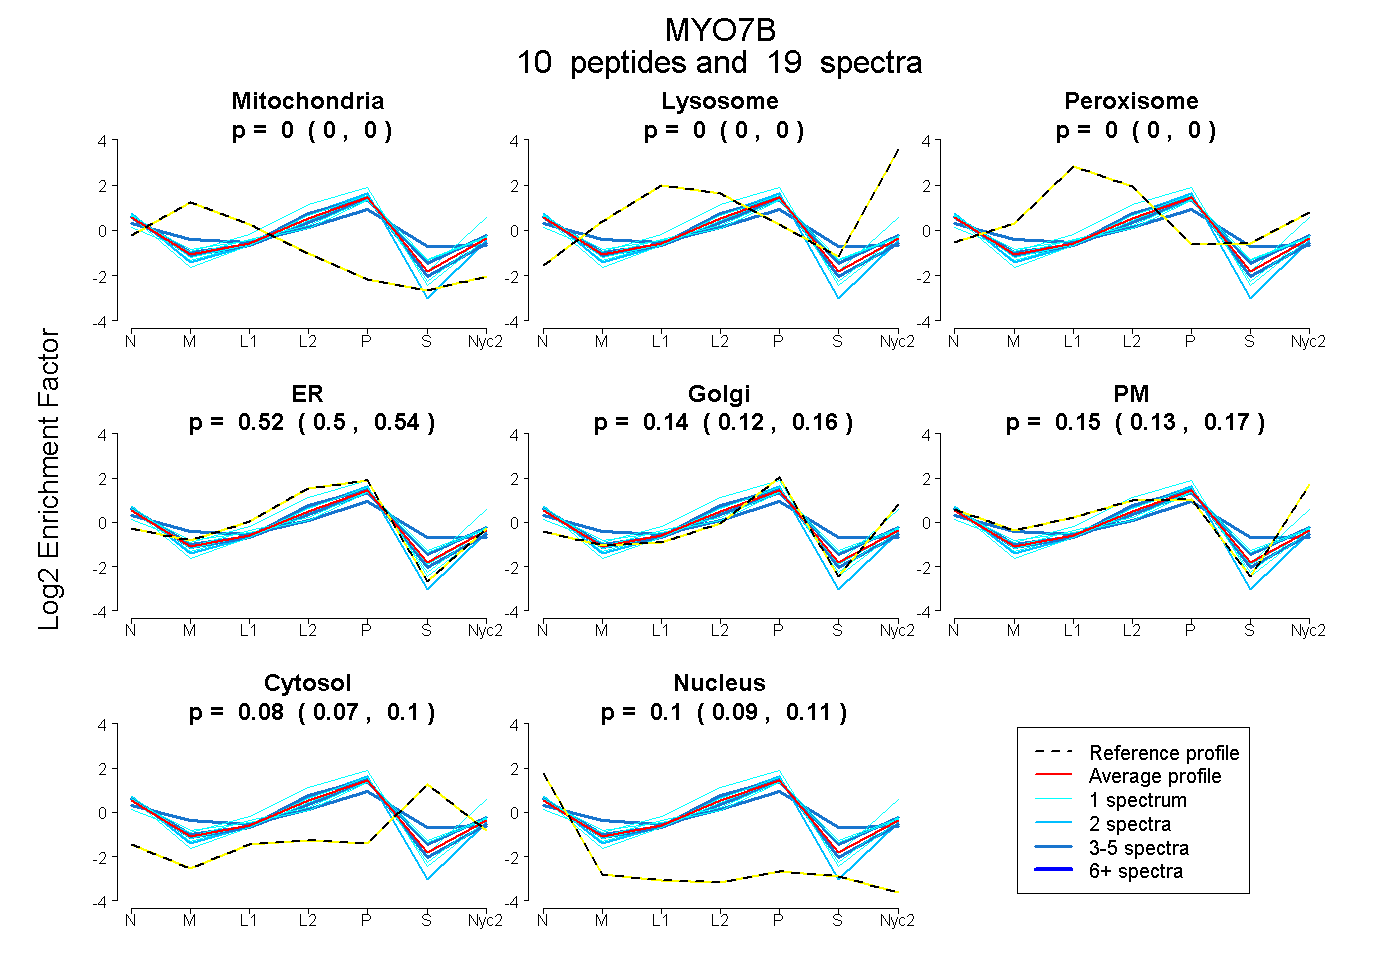
0.000 | 0.000
0.000 | 0.000
0.000 | 0.000
0.496 | 0.538
0.116 | 0.163
0.134 | 0.168
0.065 | 0.099
0.093 | 0.111
7peptides
spectra
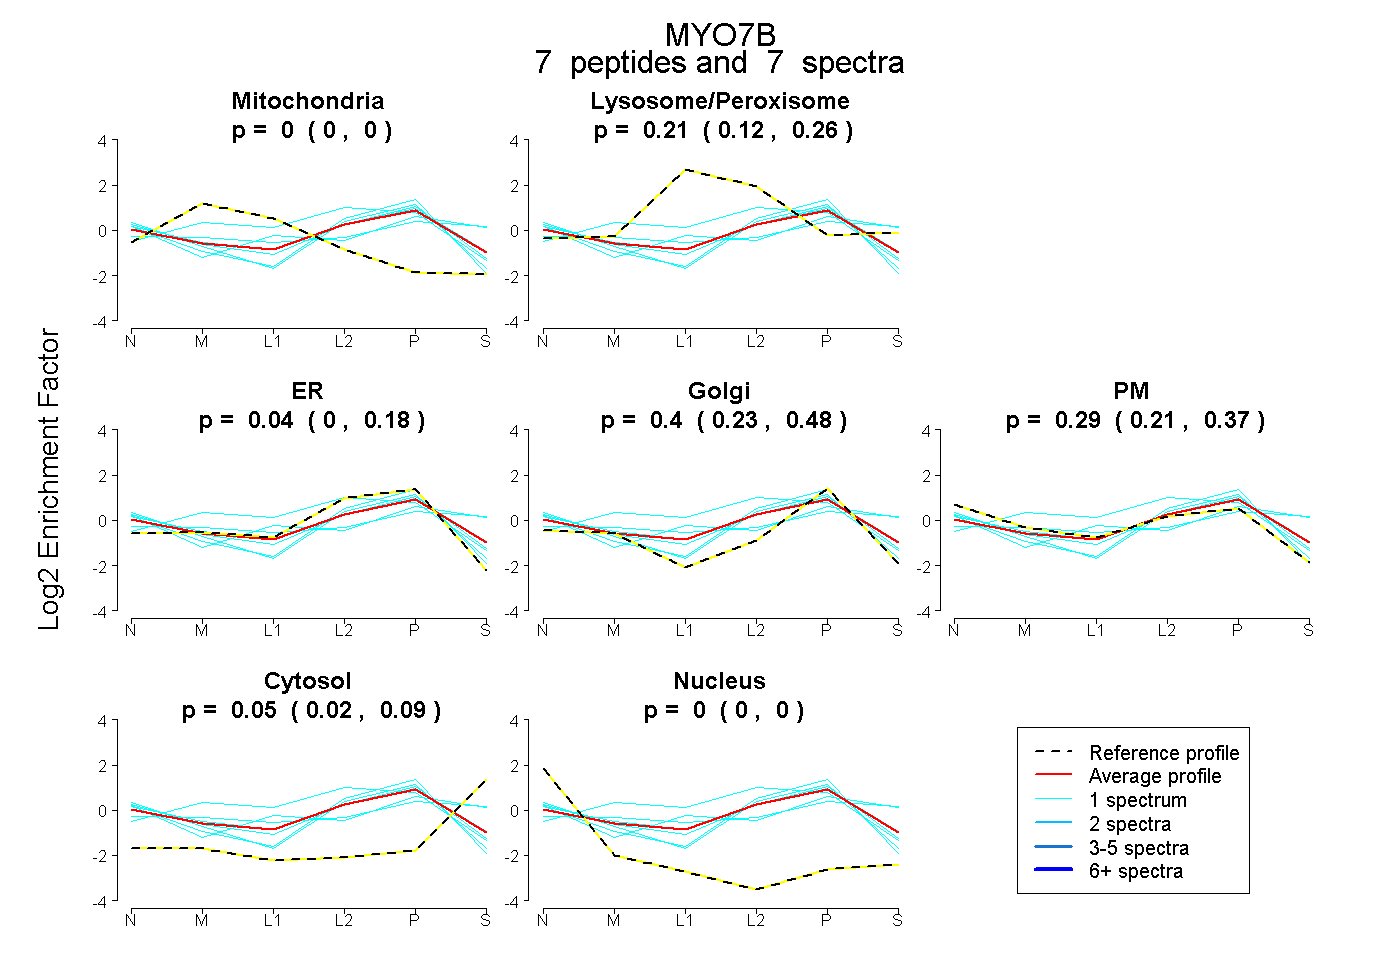
0.000 | 0.000
0.117 | 0.255
0.000 | 0.179
0.233 | 0.478
0.208 | 0.370
0.022 | 0.088
0.000 | 0.000
10peptides
spectra
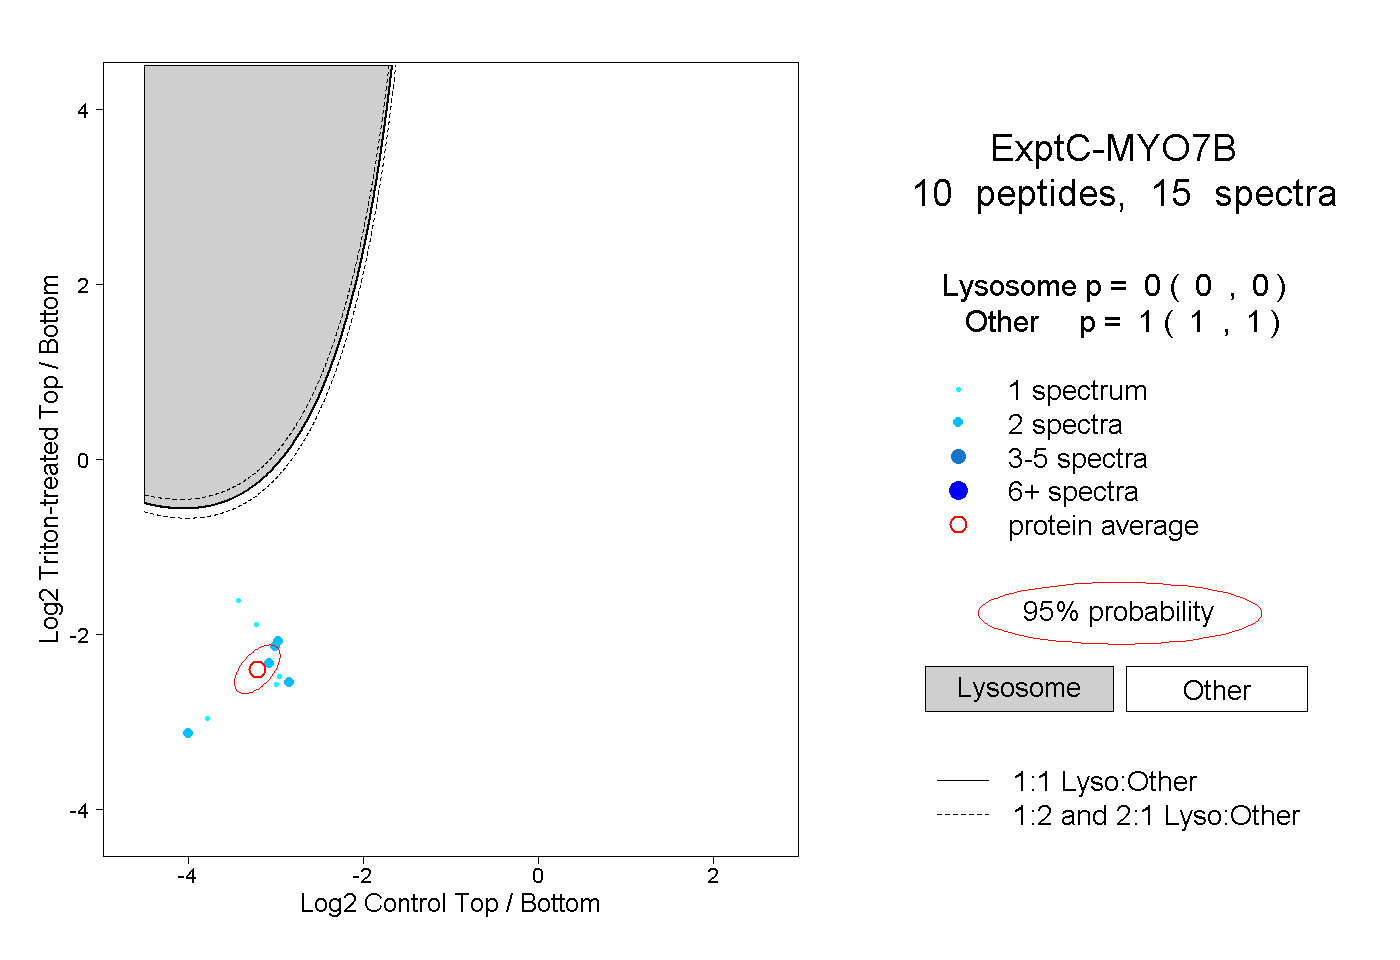
0.000 | 0.000
1.000 | 1.000
2peptides
spectra
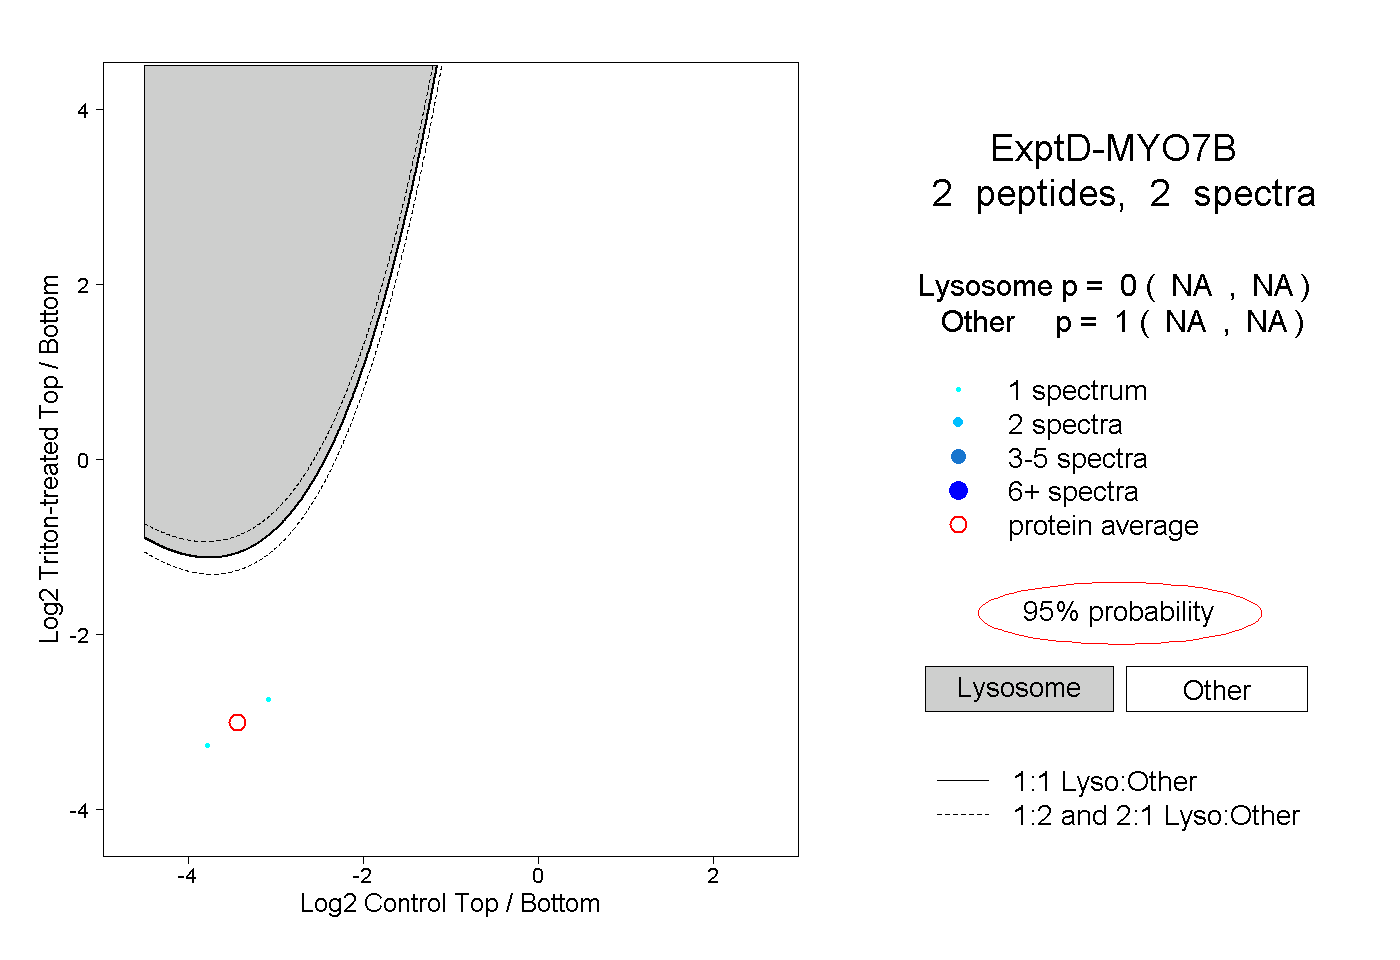
NA | NA
NA | NA