 10
10peptides
spectra
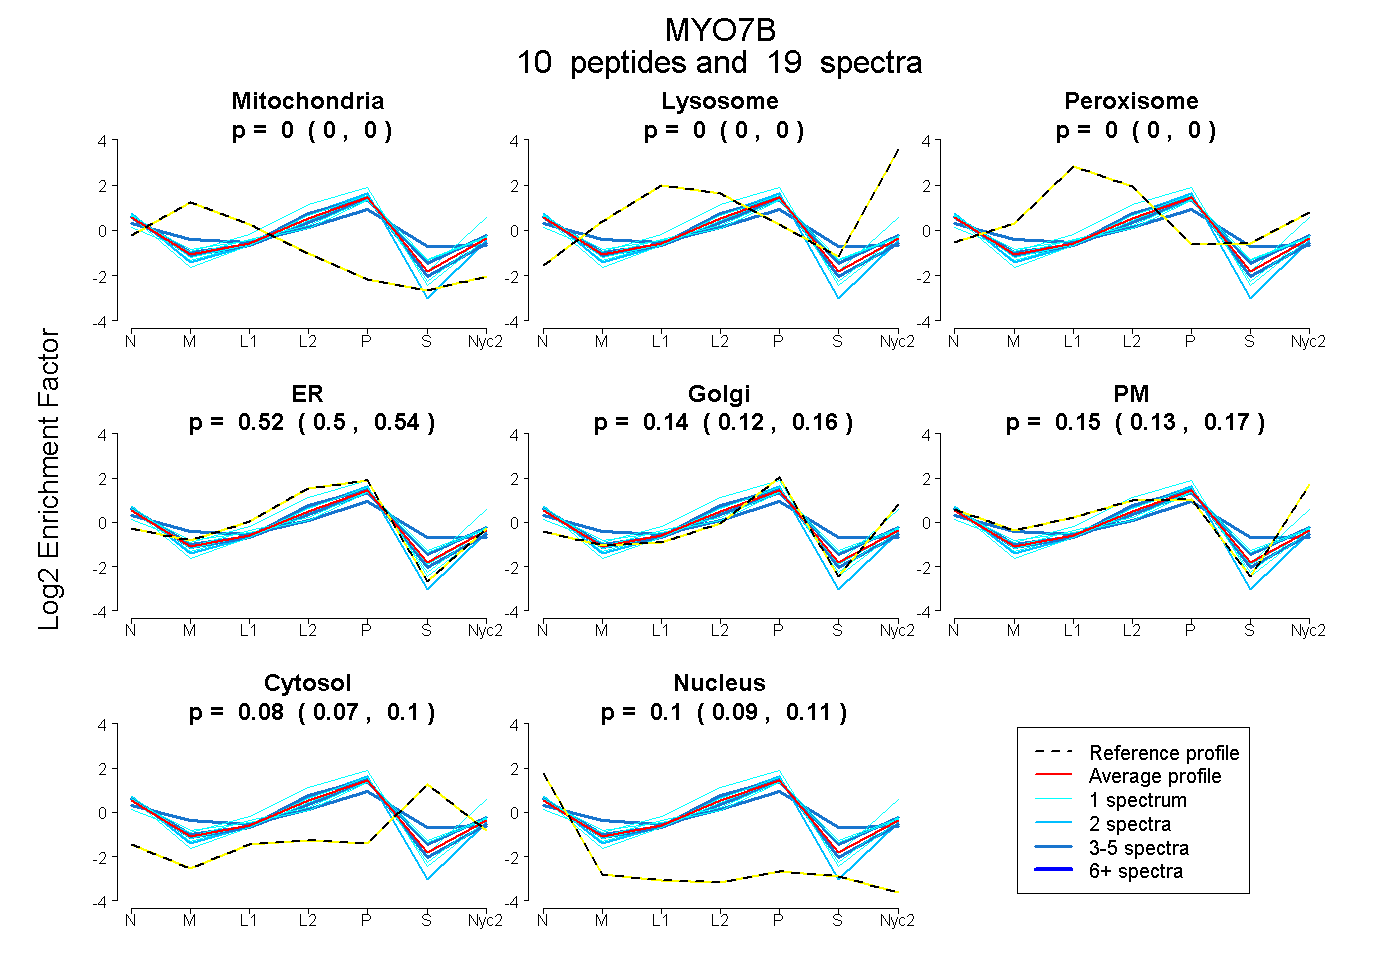
0.000 | 0.000
0.000 | 0.000
0.000 | 0.000
0.496 | 0.538
0.116 | 0.163
0.134 | 0.168
0.065 | 0.099
0.093 | 0.111
| Plot | Mito | Lyso | Perox | ER | Golgi | PM | Cytosol | Nucleus | |||||
| Expt A |
10 peptides |
19 spectra |
|
0.000 0.000 | 0.000 |
0.000 0.000 | 0.000 |
0.000 0.000 | 0.000 |
0.518 0.496 | 0.538 |
0.144 0.116 | 0.163 |
0.153 0.134 | 0.168 |
0.083 0.065 | 0.099 |
0.102 0.093 | 0.111 |
| 2 spectra, EGDFFFDSLR | 0.000 | 0.000 | 0.000 | 0.654 | 0.131 | 0.067 | 0.000 | 0.148 | ||
| 3 spectra, HGLLLIHPK | 0.000 | 0.000 | 0.000 | 0.665 | 0.049 | 0.121 | 0.038 | 0.128 | ||
| 1 spectrum, LILMGFER | 0.000 | 0.000 | 0.000 | 0.442 | 0.142 | 0.221 | 0.062 | 0.133 | ||
| 1 spectrum, HIPIQVILATGR | 0.000 | 0.000 | 0.000 | 0.841 | 0.098 | 0.013 | 0.000 | 0.048 | ||
| 1 spectrum, SLTISVDSASTSR | 0.000 | 0.000 | 0.000 | 0.512 | 0.193 | 0.171 | 0.000 | 0.124 | ||
| 5 spectra, FEDLEVK | 0.000 | 0.000 | 0.000 | 0.394 | 0.182 | 0.194 | 0.146 | 0.084 | ||
| 1 spectrum, IVQLQAR | 0.000 | 0.000 | 0.000 | 0.449 | 0.175 | 0.119 | 0.185 | 0.071 | ||
| 3 spectra, AVVIIQAHAR | 0.117 | 0.000 | 0.000 | 0.394 | 0.061 | 0.138 | 0.290 | 0.000 | ||
| 1 spectrum, EEDLVELLAR | 0.000 | 0.000 | 0.000 | 0.263 | 0.254 | 0.365 | 0.079 | 0.038 | ||
| 1 spectrum, SSLTGSSVMR | 0.000 | 0.000 | 0.039 | 0.326 | 0.244 | 0.163 | 0.139 | 0.089 |
| Plot | Mito | Lyso or Perox | ER | Golgi | PM | Cytosol | Nucleus | ||||||
| Expt B |
7 peptides |
7 spectra |
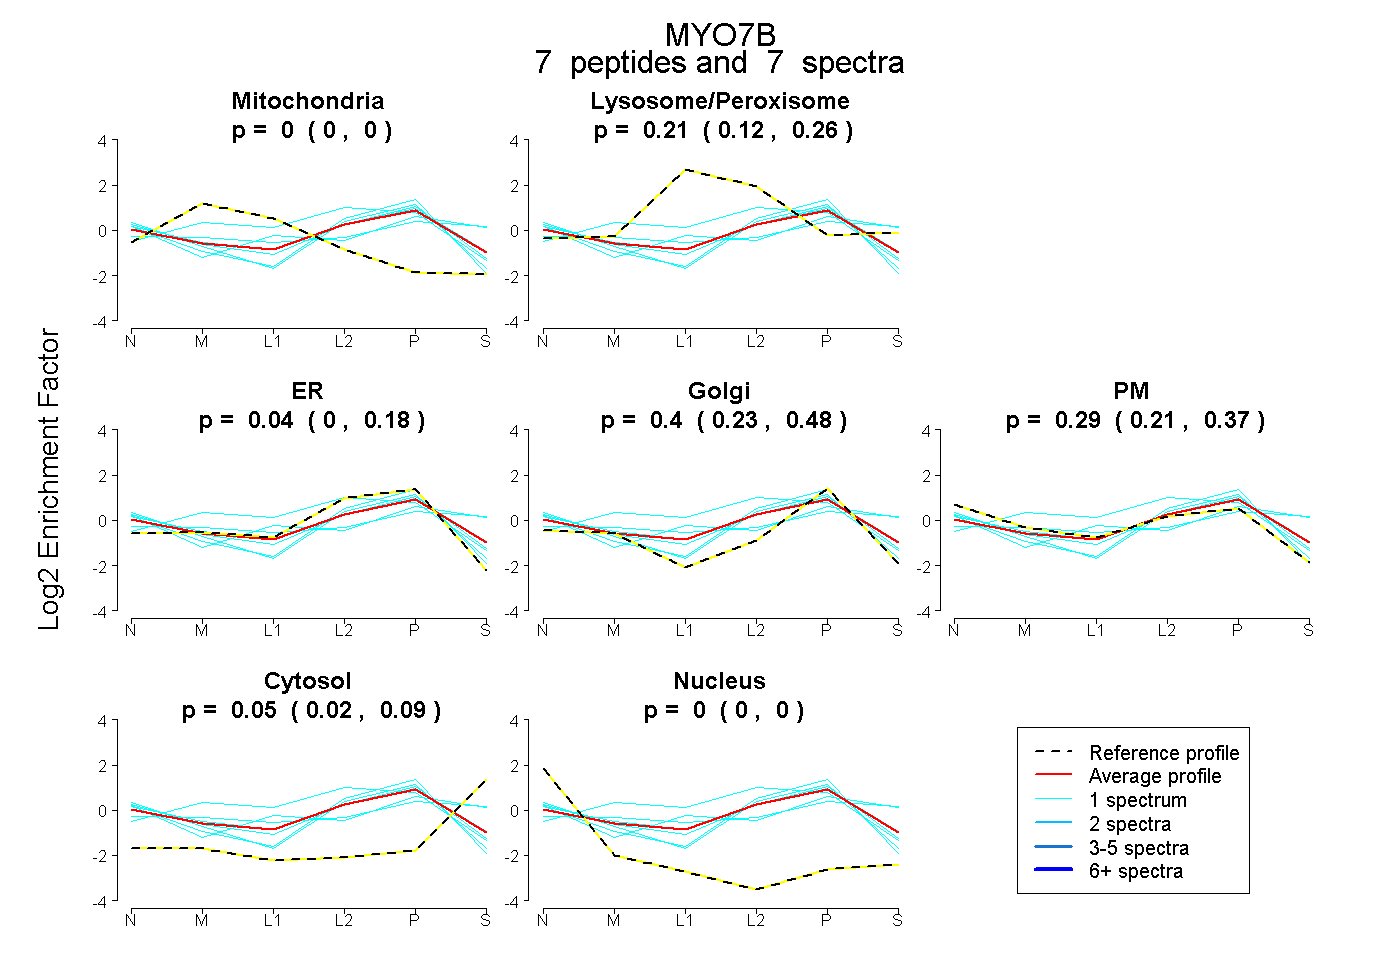 |
0.000 0.000 | 0.000 |
0.208 0.117 | 0.255 |
0.040 0.000 | 0.179 |
0.402 0.233 | 0.478 |
0.295 0.208 | 0.370 |
0.054 0.022 | 0.088 |
0.000 0.000 | 0.000 |
|||
| Plot | Lyso | Other | |||||||||||
| Expt C |
10 peptides |
15 spectra |
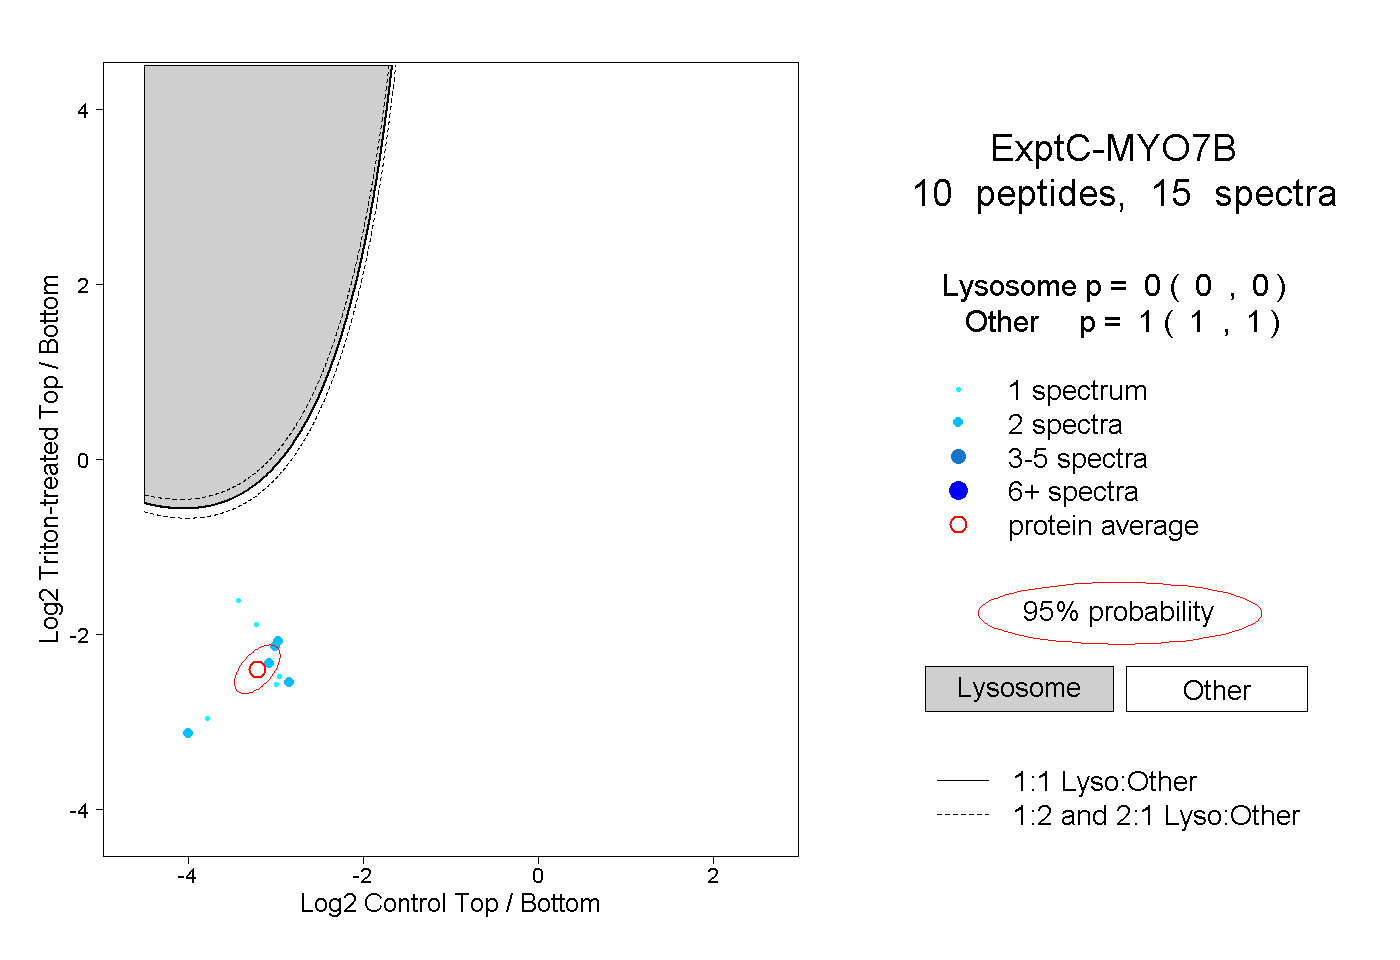 |
0.000 0.000 | 0.000 |
1.000 1.000 | 1.000 |
||||||||
| Plot | Lyso | Other | |||||||||||
| Expt D |
2 peptides |
2 spectra |
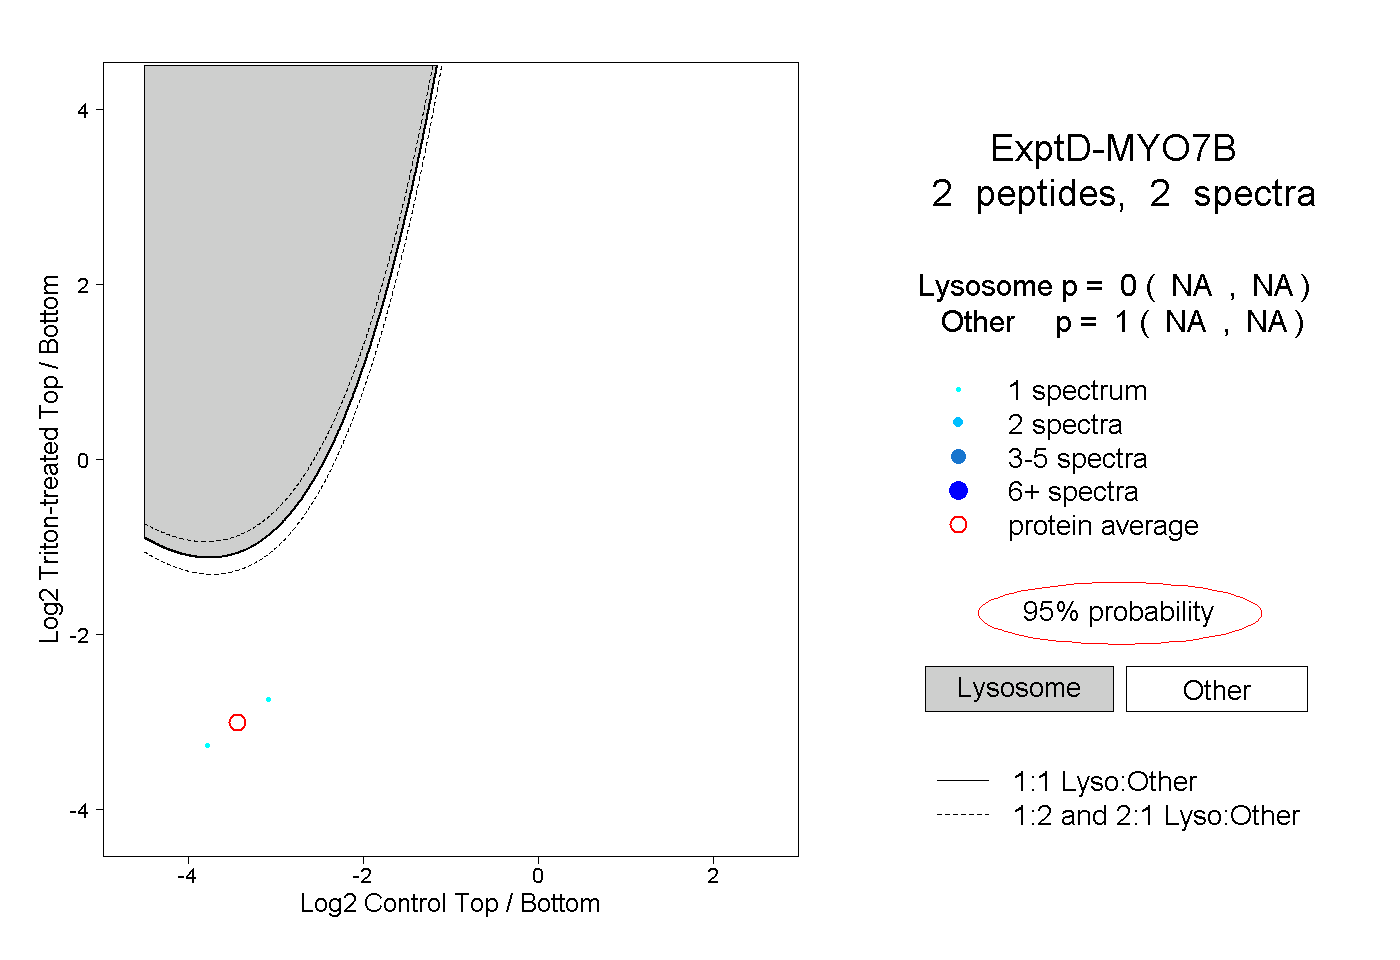 |
0.000 NA | NA |
1.000 NA | NA |