 9
9peptides
spectra
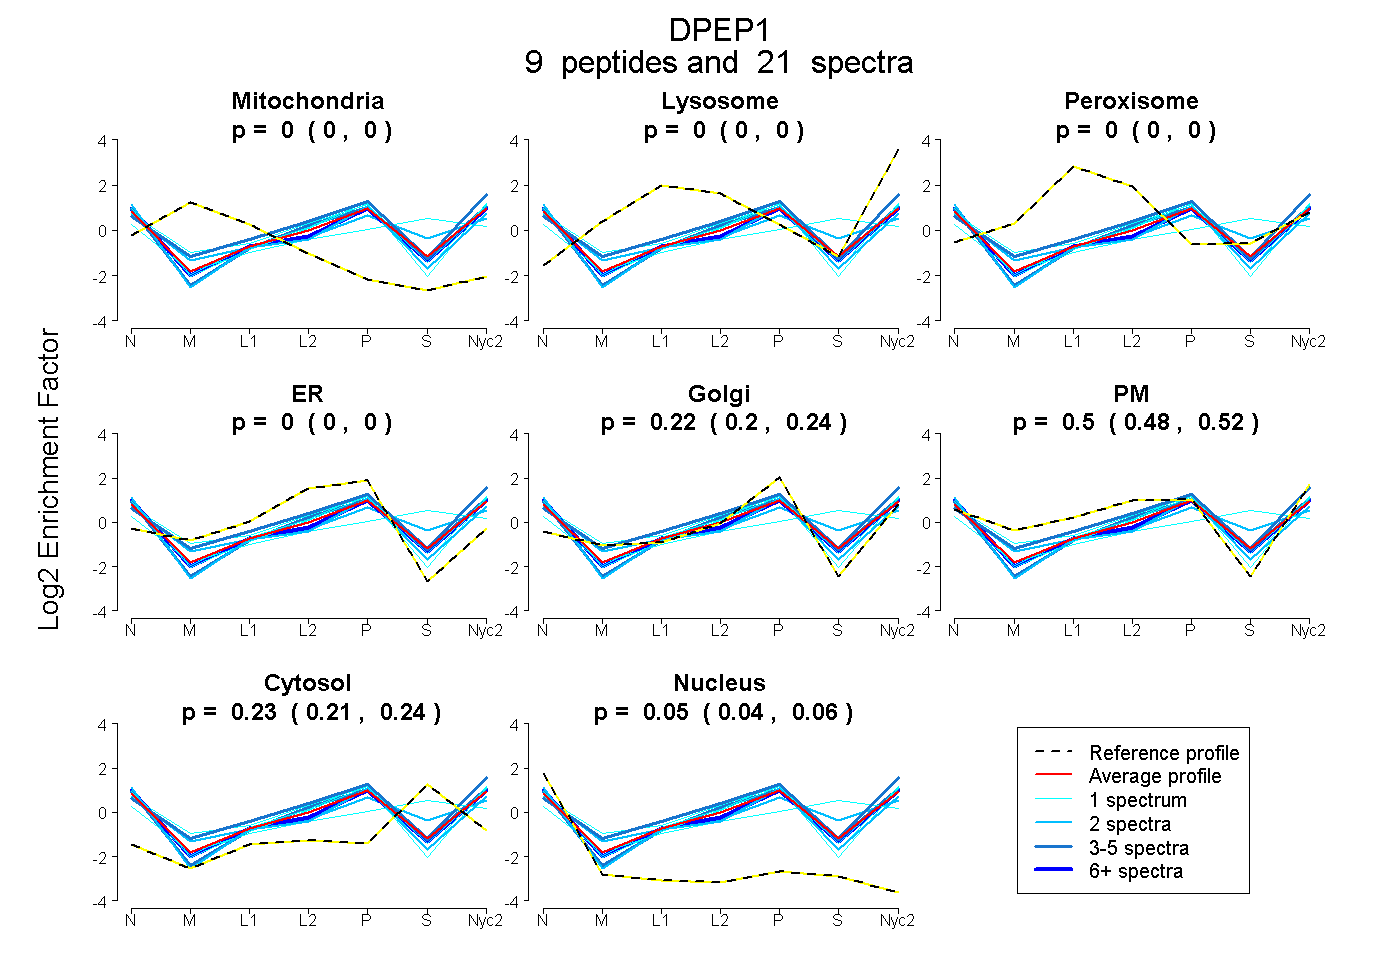
0.000 | 0.000
0.000 | 0.000
0.000 | 0.000
0.000 | 0.000
0.197 | 0.240
0.484 | 0.519
0.209 | 0.242
0.040 | 0.058
3peptides
spectra
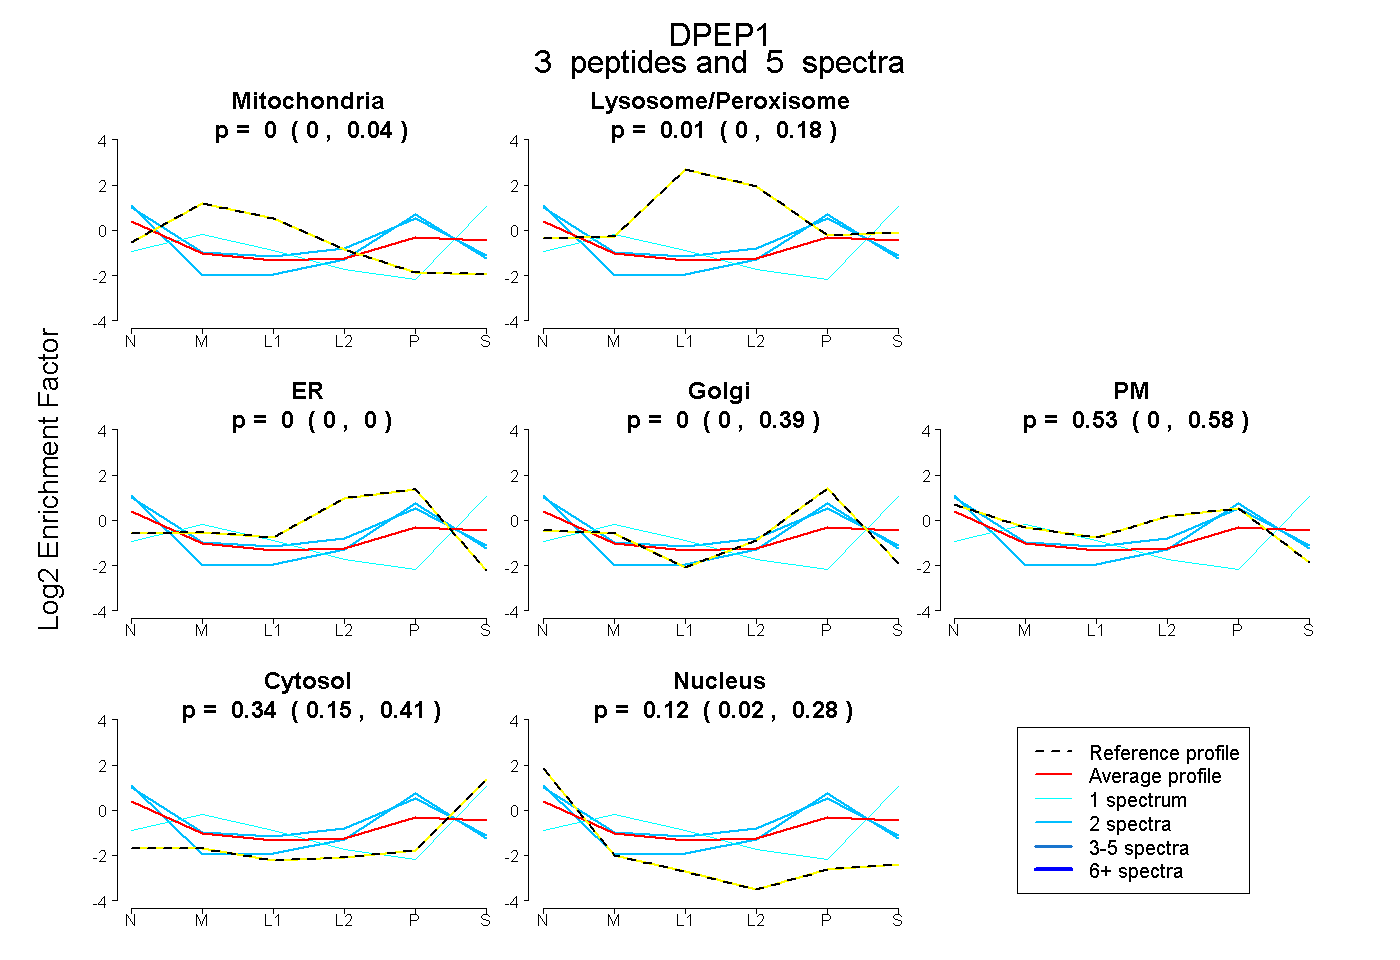
0.000 | 0.035
0.000 | 0.183
0.000 | 0.000
0.000 | 0.386
0.000 | 0.579
0.152 | 0.411
0.017 | 0.277
8peptides
spectra
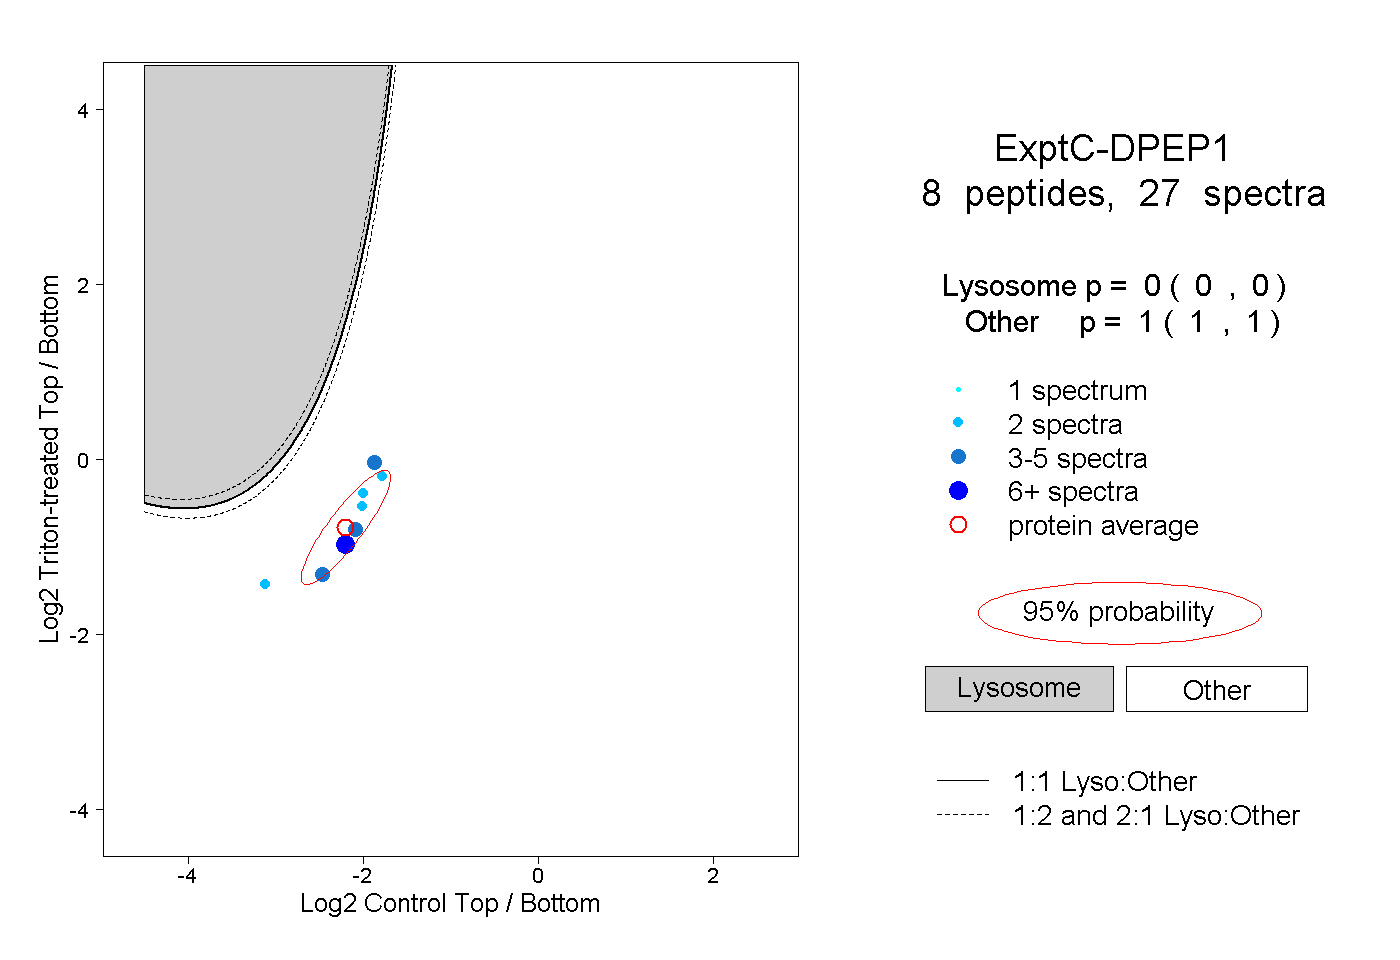
0.000 | 0.000
1.000 | 1.000
2peptides
spectra
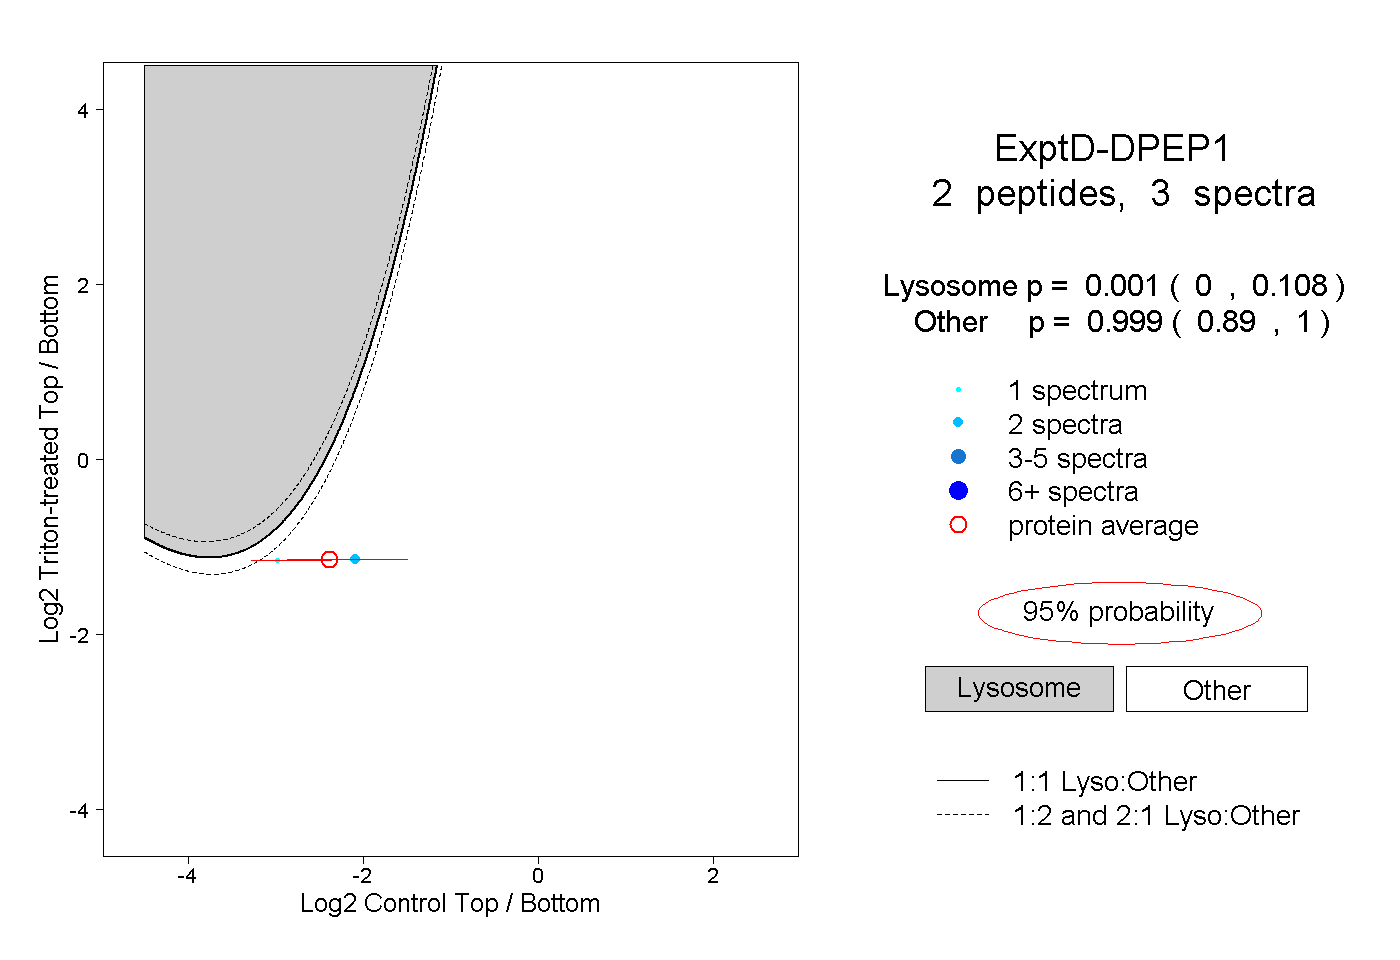
0.000 | 0.108
0.890 | 1.000