 9
9peptides
spectra
0.000 | 0.000
0.000 | 0.000
0.000 | 0.000
0.000 | 0.000
0.197 | 0.240
0.484 | 0.519
0.209 | 0.242
0.040 | 0.058
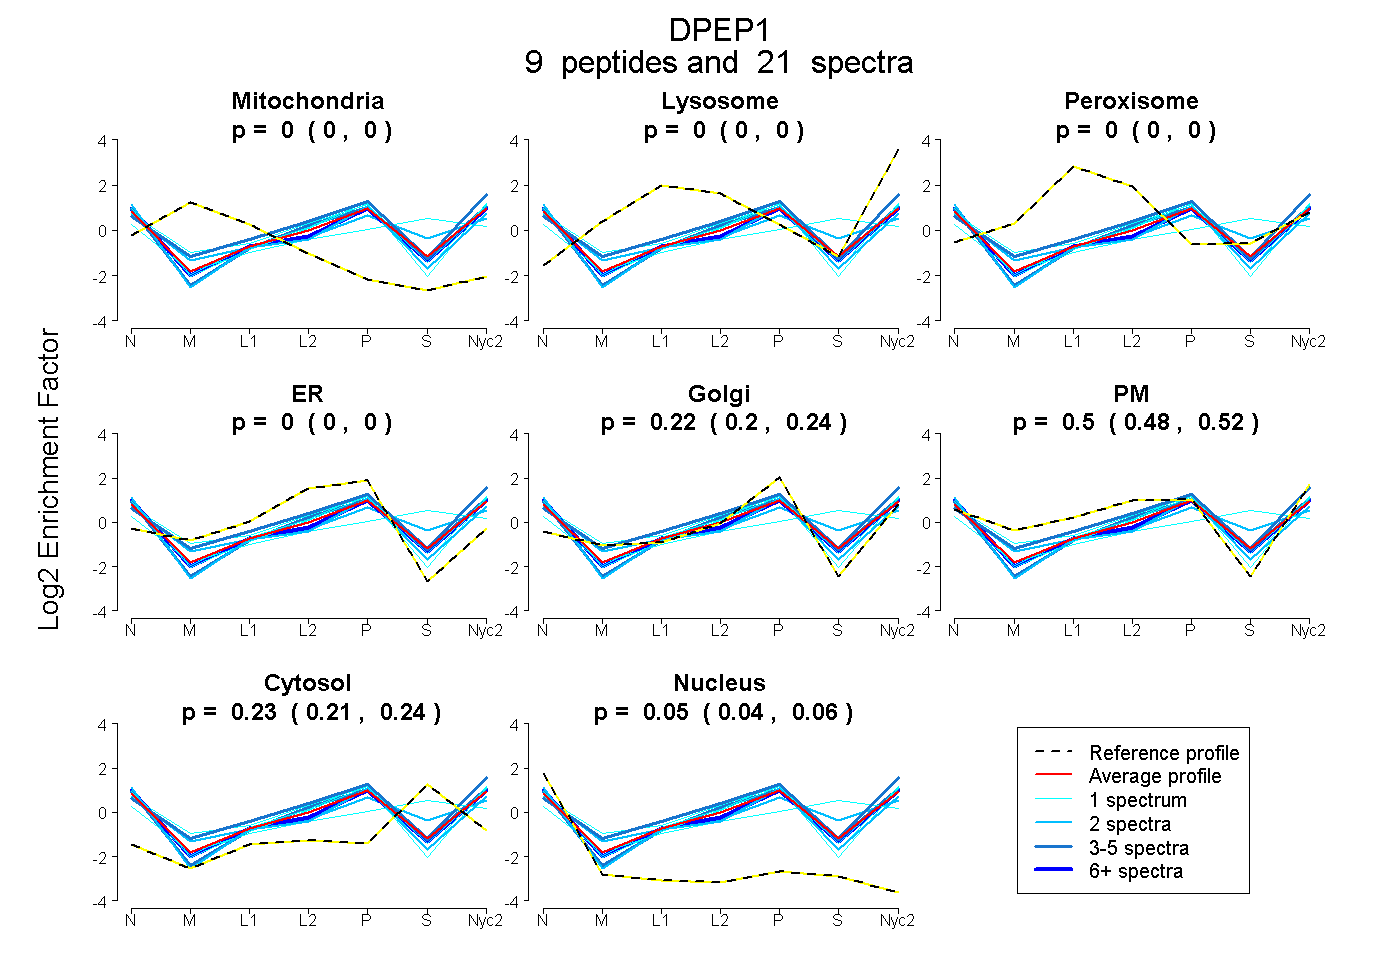
| Plot | Mito | Lyso | Perox | ER | Golgi | PM | Cytosol | Nucleus | |||||
| Expt A |
9 peptides |
21 spectra |
|
0.000 0.000 | 0.000 |
0.000 0.000 | 0.000 |
0.000 0.000 | 0.000 |
0.000 0.000 | 0.000 |
0.220 0.197 | 0.240 |
0.503 0.484 | 0.519 |
0.228 0.209 | 0.242 |
0.049 0.040 | 0.058 |
| 1 spectrum, NQAENIMR | 0.000 | 0.000 | 0.000 | 0.000 | 0.208 | 0.616 | 0.158 | 0.018 | ||
| 1 spectrum, NVPDDVLQLVK | 0.000 | 0.000 | 0.000 | 0.000 | 0.348 | 0.486 | 0.047 | 0.119 | ||
| 2 spectra, YPDLIAELLR | 0.000 | 0.000 | 0.000 | 0.000 | 0.363 | 0.370 | 0.117 | 0.151 | ||
| 1 spectrum, LVLNEMNR | 0.000 | 0.000 | 0.000 | 0.000 | 0.344 | 0.487 | 0.101 | 0.067 | ||
| 3 spectra, ILEQIDVIHR | 0.000 | 0.000 | 0.000 | 0.000 | 0.239 | 0.486 | 0.224 | 0.051 | ||
| 2 spectra, DALQLSK | 0.000 | 0.000 | 0.000 | 0.000 | 0.086 | 0.506 | 0.377 | 0.031 | ||
| 6 spectra, GLLAENLLR | 0.000 | 0.000 | 0.000 | 0.000 | 0.242 | 0.483 | 0.193 | 0.082 | ||
| 4 spectra, TLYHLGMR | 0.000 | 0.000 | 0.000 | 0.000 | 0.147 | 0.680 | 0.172 | 0.000 | ||
| 1 spectrum, LDGSCR | 0.000 | 0.000 | 0.000 | 0.000 | 0.000 | 0.389 | 0.611 | 0.000 |
| Plot | Mito | Lyso or Perox | ER | Golgi | PM | Cytosol | Nucleus | ||||||
| Expt B |
3 peptides |
5 spectra |
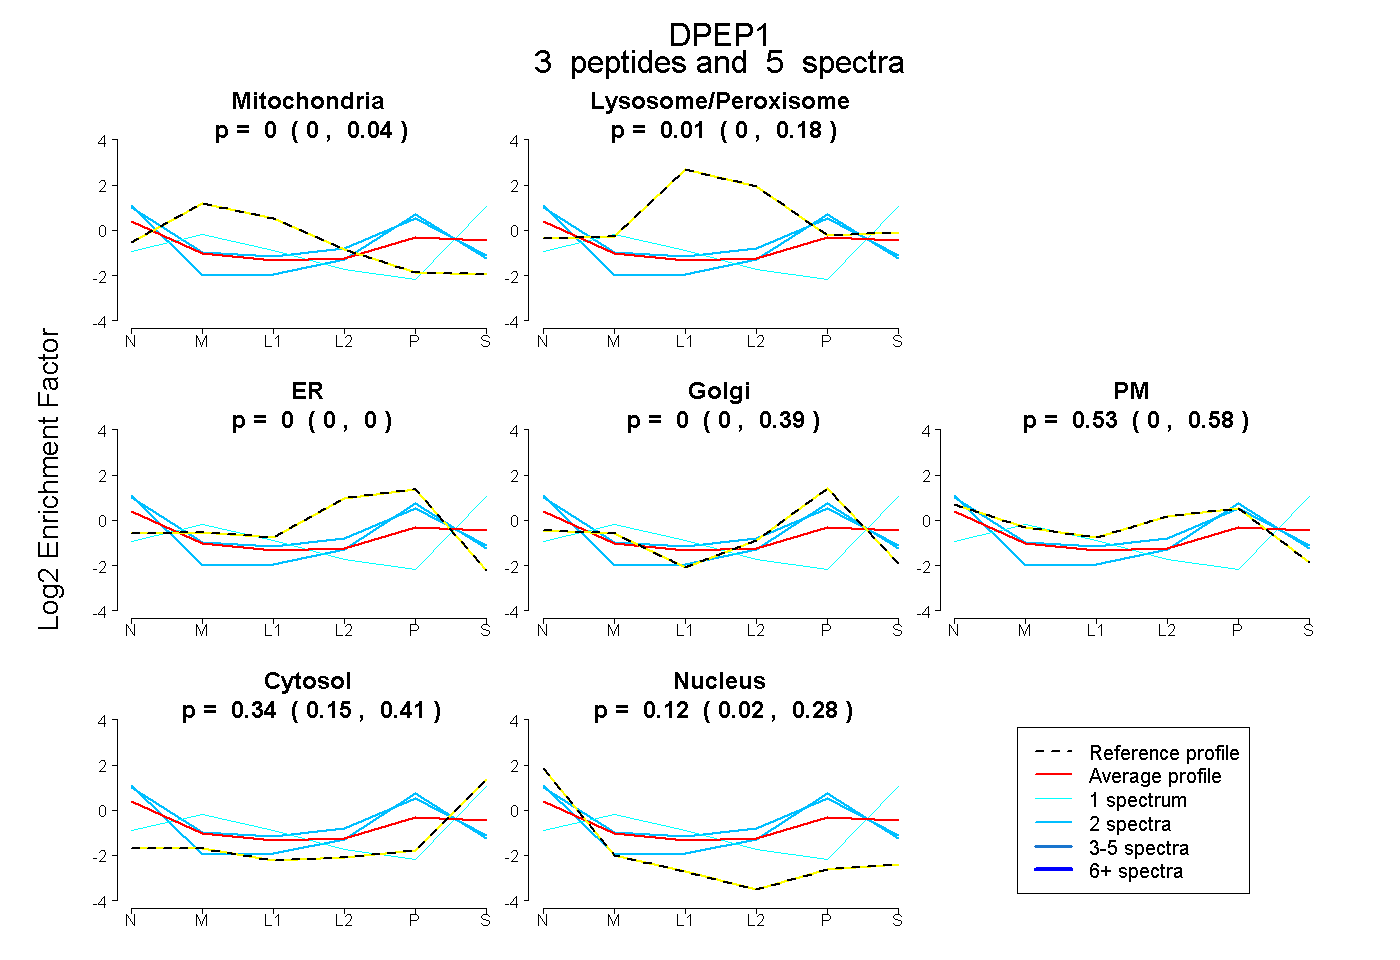 |
0.000 0.000 | 0.035 |
0.014 0.000 | 0.183 |
0.000 0.000 | 0.000 |
0.000 0.000 | 0.386 |
0.529 0.000 | 0.579 |
0.336 0.152 | 0.411 |
0.121 0.017 | 0.277 |
|||
| Plot | Lyso | Other | |||||||||||
| Expt C |
8 peptides |
27 spectra |
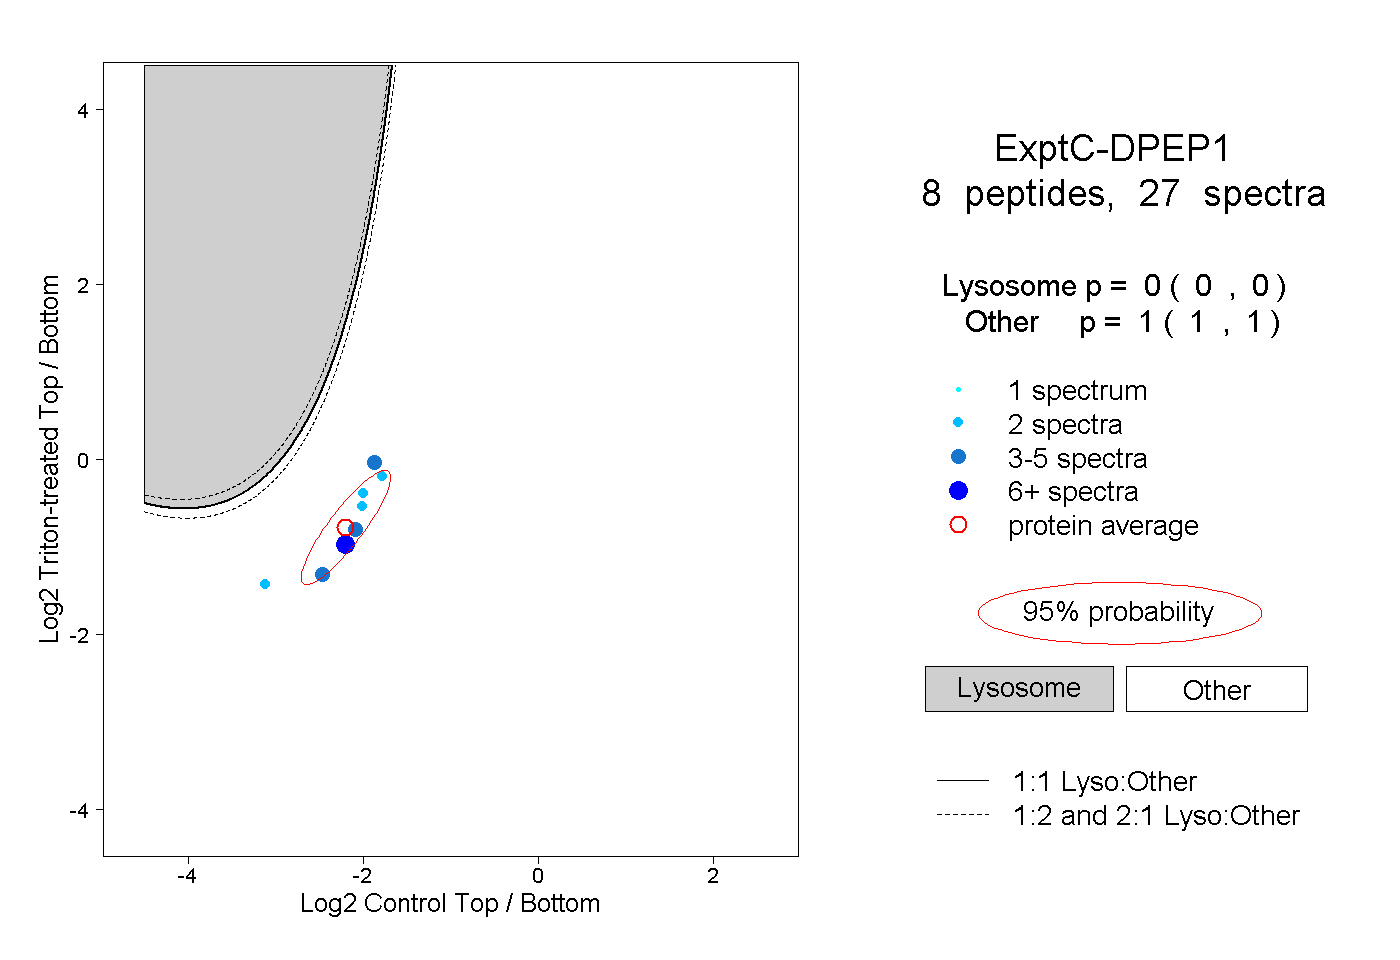 |
0.000 0.000 | 0.000 |
1.000 1.000 | 1.000 |
||||||||
| Plot | Lyso | Other | |||||||||||
| Expt D |
2 peptides |
3 spectra |
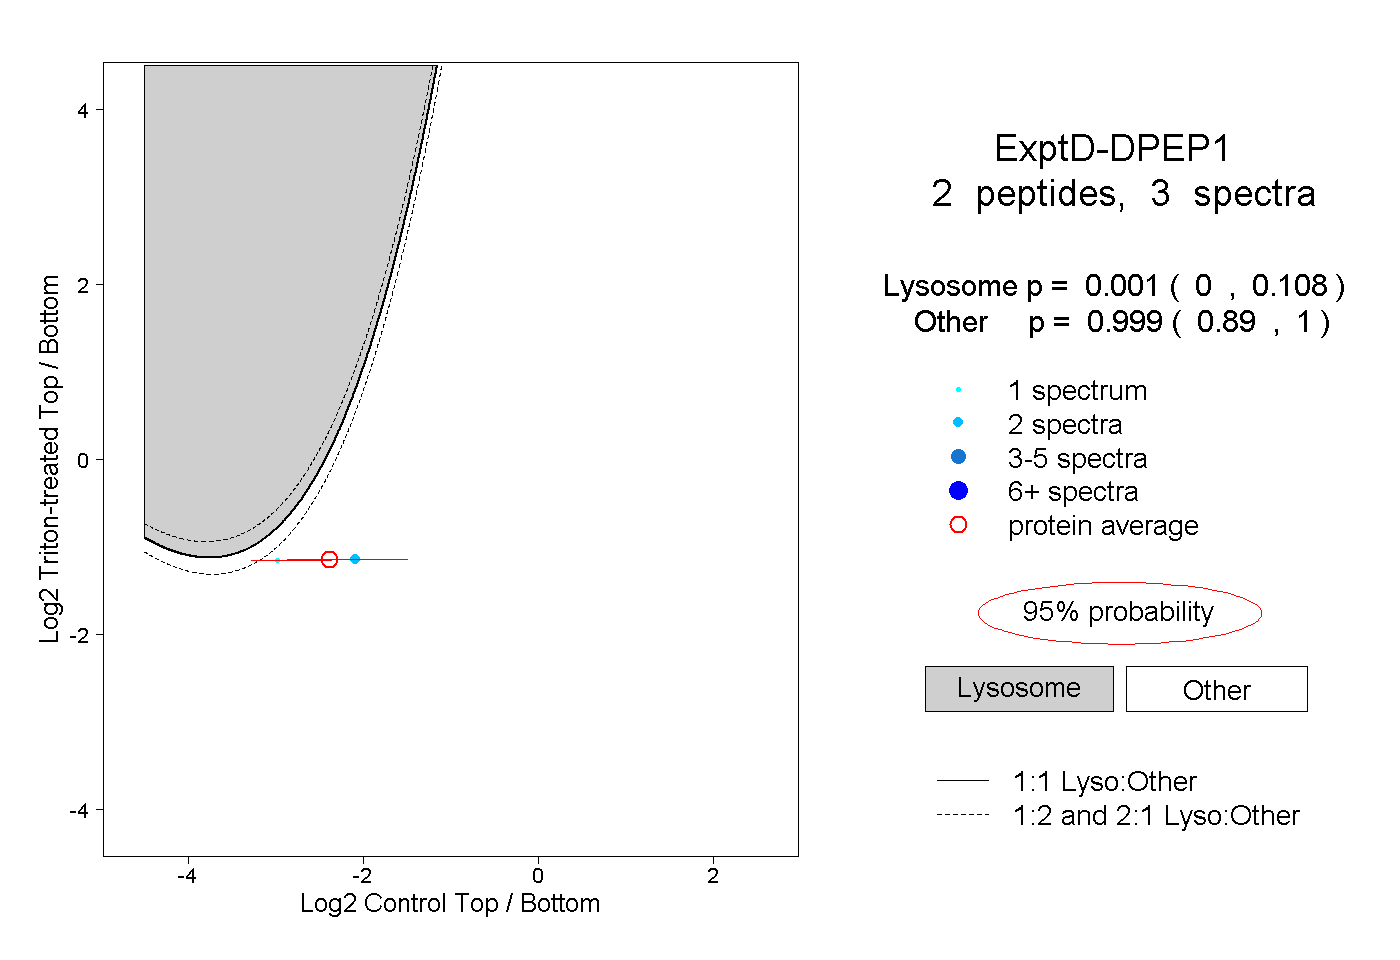 |
0.001 0.000 | 0.108 |
0.999 0.890 | 1.000 |