 6
6peptides
spectra
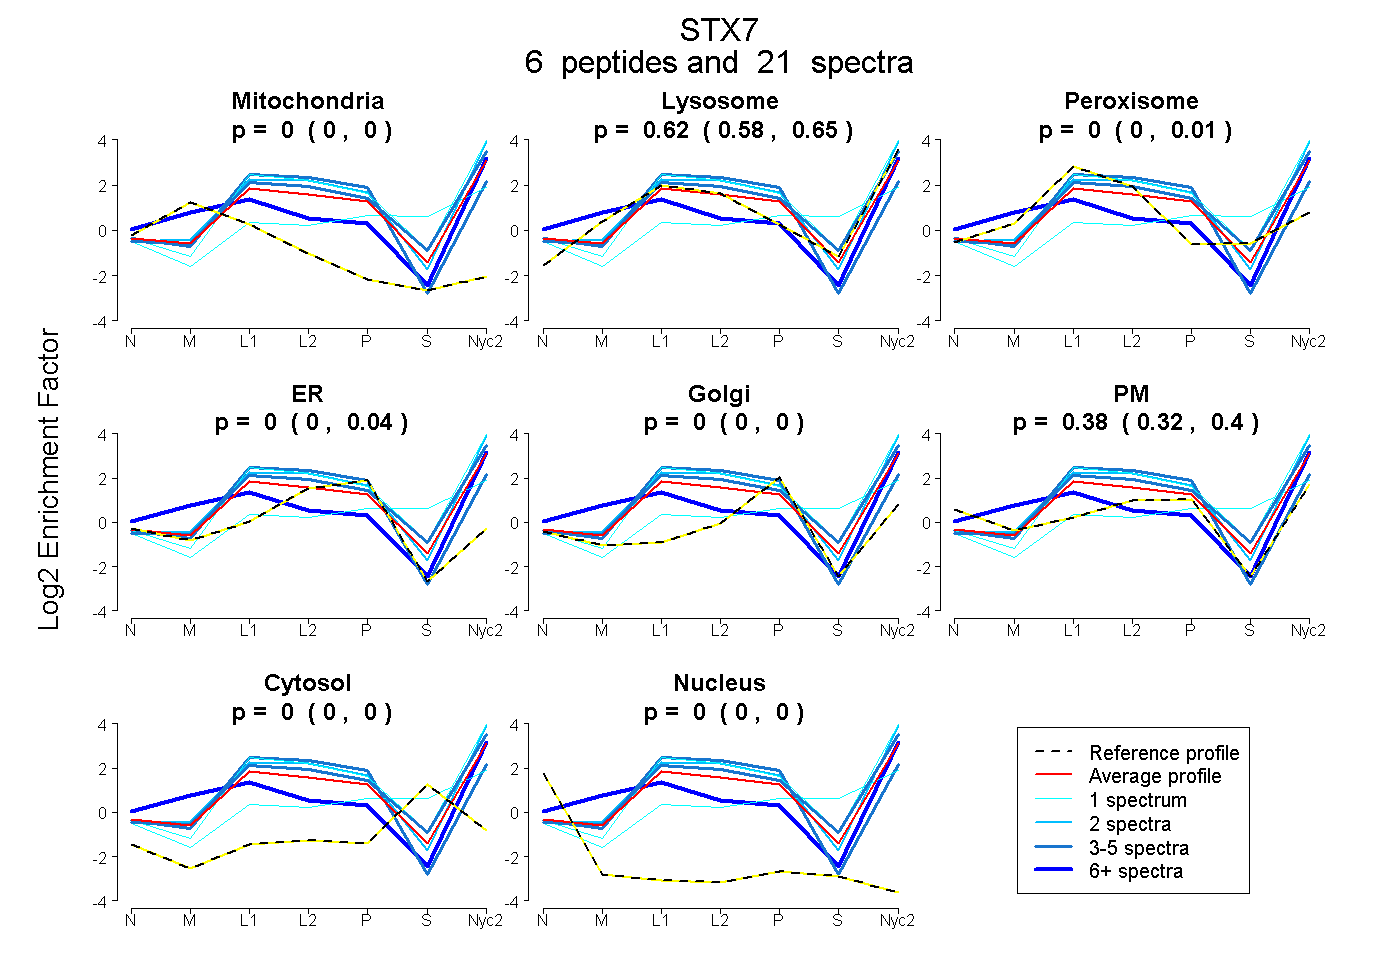
0.000 | 0.000
0.585 | 0.646
0.000 | 0.014
0.000 | 0.045
0.000 | 0.000
0.323 | 0.400
0.000 | 0.000
0.000 | 0.000
4peptides
spectra
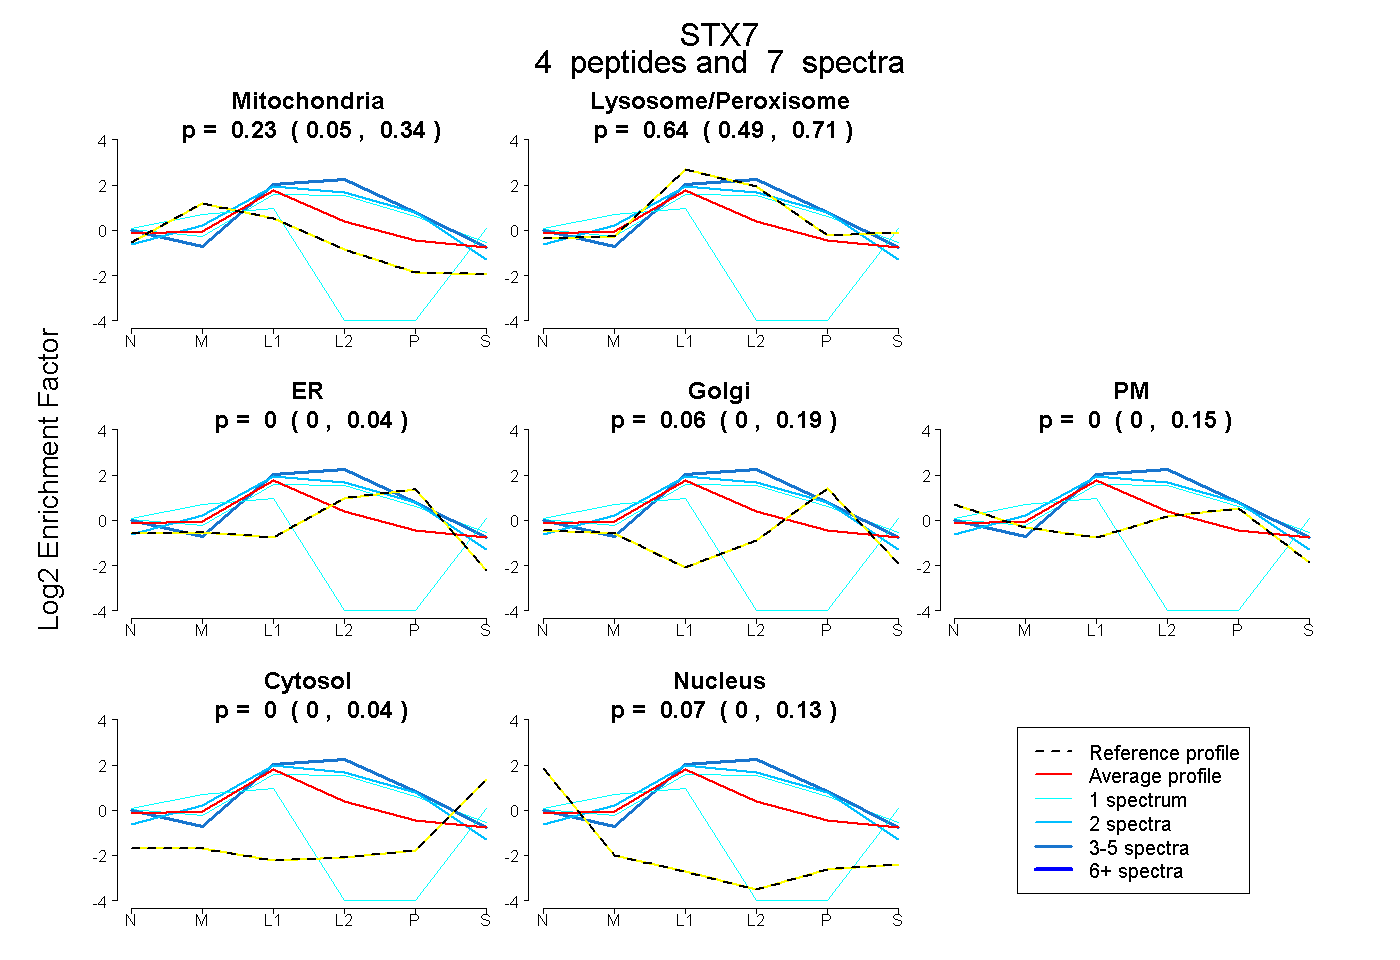
0.054 | 0.342
0.493 | 0.714
0.000 | 0.037
0.000 | 0.192
0.000 | 0.153
0.000 | 0.037
0.000 | 0.126
8peptides
spectra
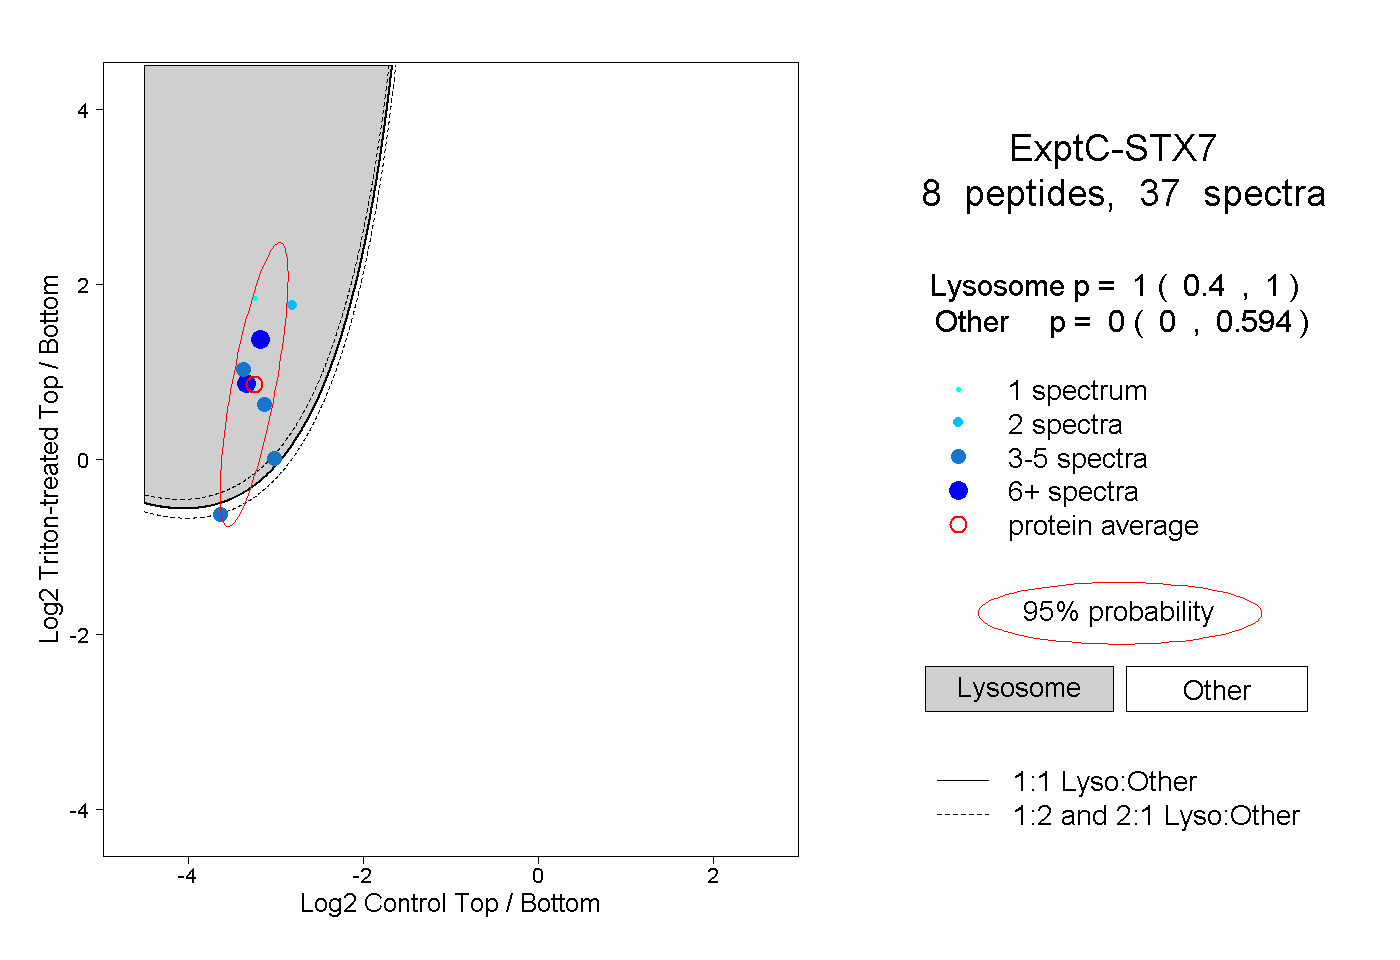
0.400 | 1.000
0.000 | 0.594
3peptides
spectra
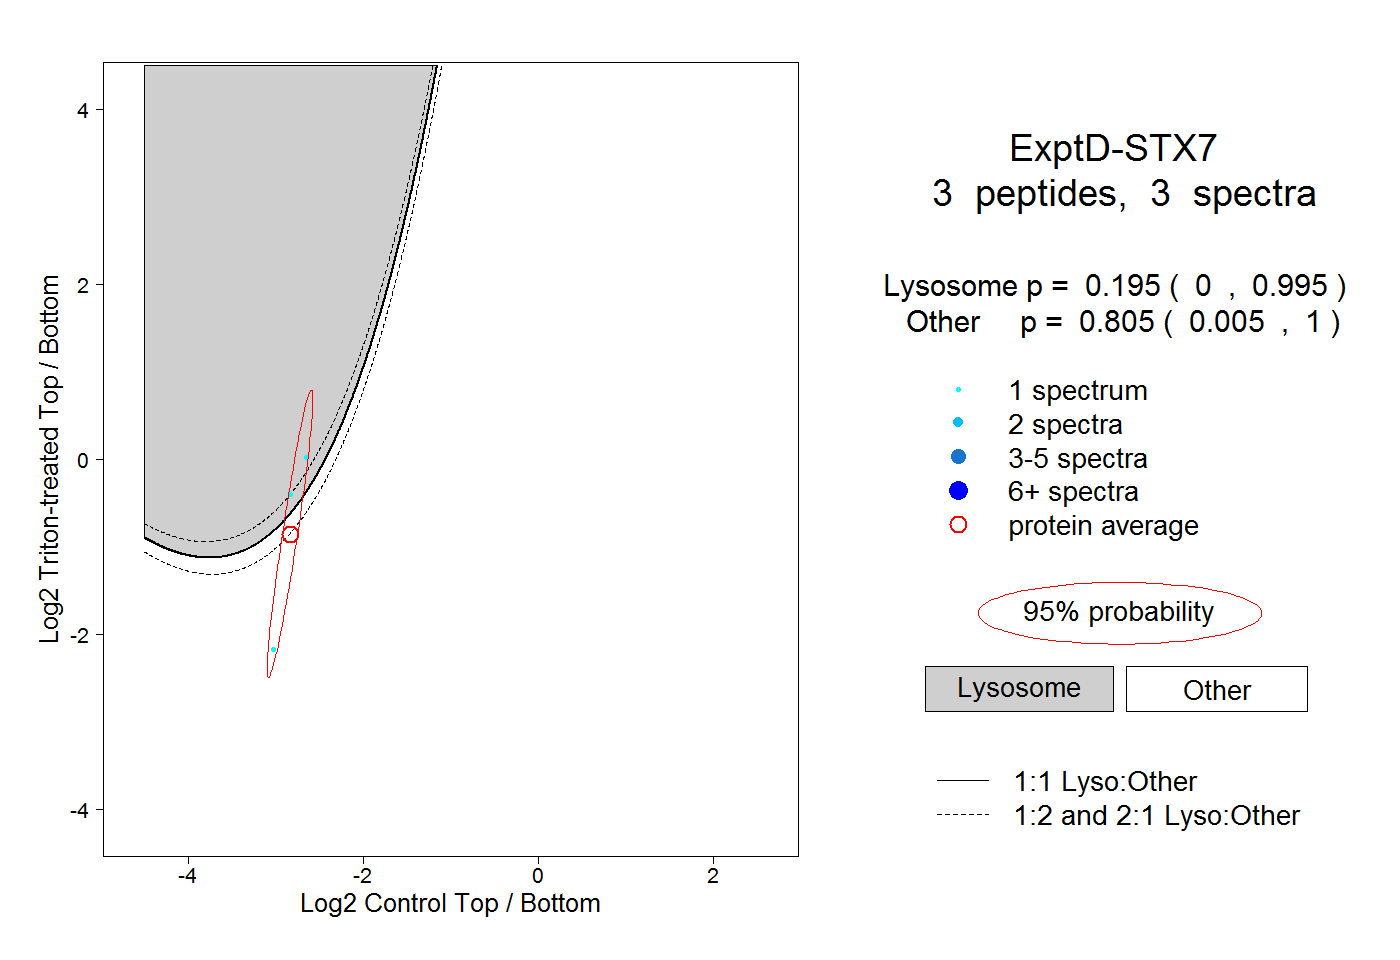
0.000 | 0.995
0.005 | 1.000