 6
6peptides
spectra
0.000 | 0.000
0.585 | 0.646
0.000 | 0.014
0.000 | 0.045
0.000 | 0.000
0.323 | 0.400
0.000 | 0.000
0.000 | 0.000
| Plot | Mito | Lyso | Perox | ER | Golgi | PM | Cytosol | Nucleus | |||||
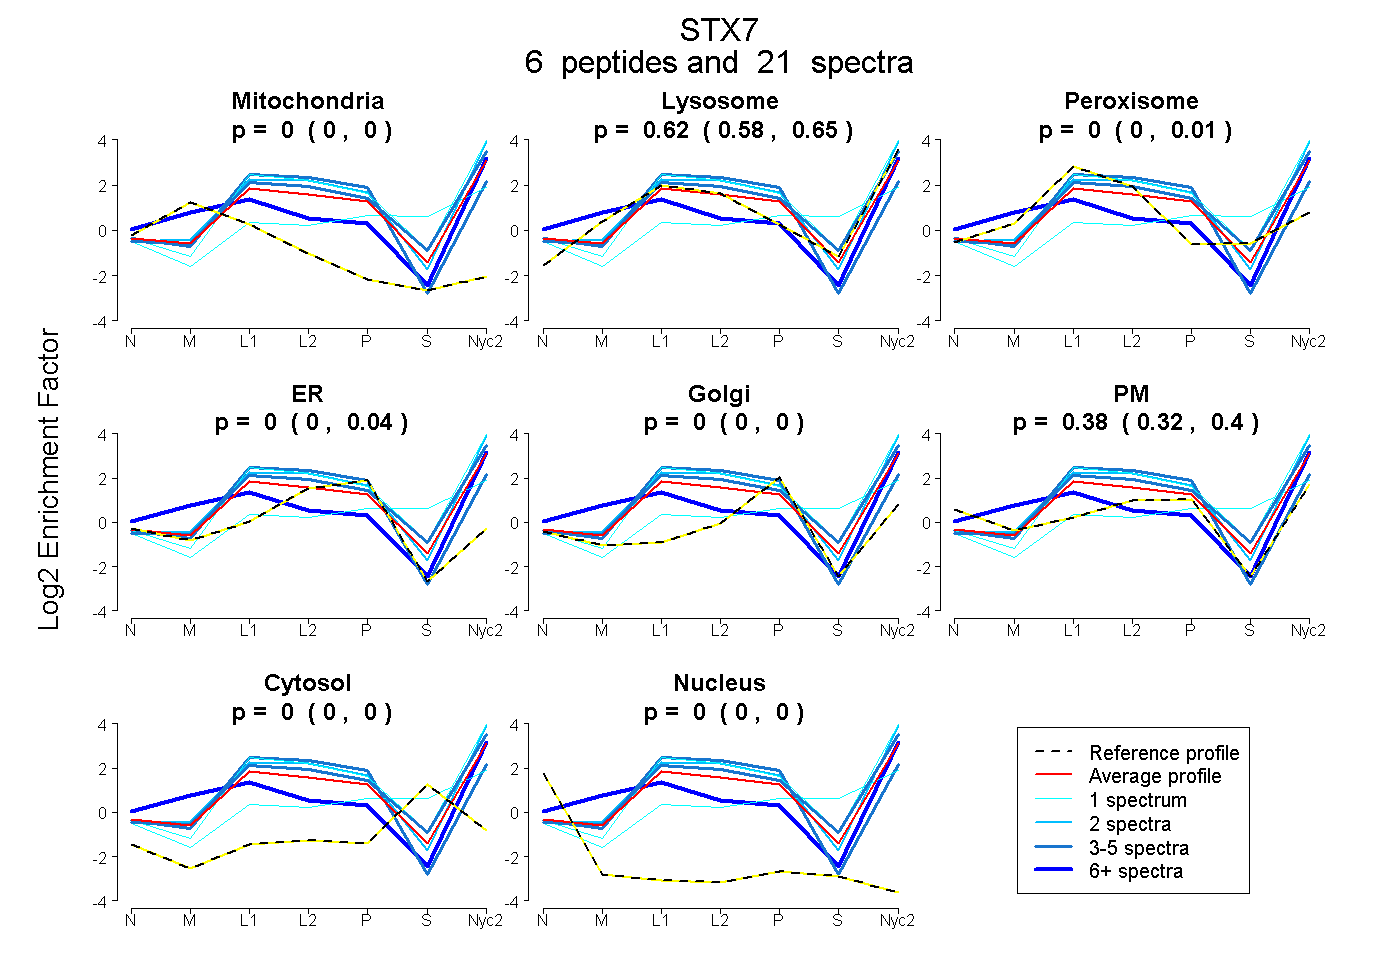
| Expt A |
6 peptides |
21 spectra |
|
0.000 0.000 | 0.000 |
0.618 0.585 | 0.646 |
0.000 0.000 | 0.014 |
0.000 0.000 | 0.045 |
0.000 0.000 | 0.000 |
0.382 0.323 | 0.400 |
0.000 0.000 | 0.000 |
0.000 0.000 | 0.000 |
| 1 spectrum, SYTPGIGGDPAQLAQR | 0.000 | 0.406 | 0.000 | 0.000 | 0.046 | 0.133 | 0.415 | 0.000 | ||
| 2 spectra, ISSNIQK | 0.000 | 0.784 | 0.000 | 0.000 | 0.000 | 0.216 | 0.000 | 0.000 | ||
| 4 spectra, VSGGFPEDSSK | 0.000 | 0.773 | 0.000 | 0.003 | 0.000 | 0.224 | 0.000 | 0.000 | ||
| 4 spectra, ITQCSAEIQR | 0.000 | 0.532 | 0.000 | 0.468 | 0.000 | 0.000 | 0.000 | 0.000 | ||
| 1 spectrum, LVAEFTTALTNFQK | 0.000 | 0.839 | 0.000 | 0.000 | 0.000 | 0.161 | 0.000 | 0.000 | ||
| 9 spectra, AANYQR | 0.054 | 0.507 | 0.000 | 0.000 | 0.000 | 0.439 | 0.000 | 0.000 |
| Plot | Mito | Lyso or Perox | ER | Golgi | PM | Cytosol | Nucleus | ||||||
| Expt B |
4 peptides |
7 spectra |
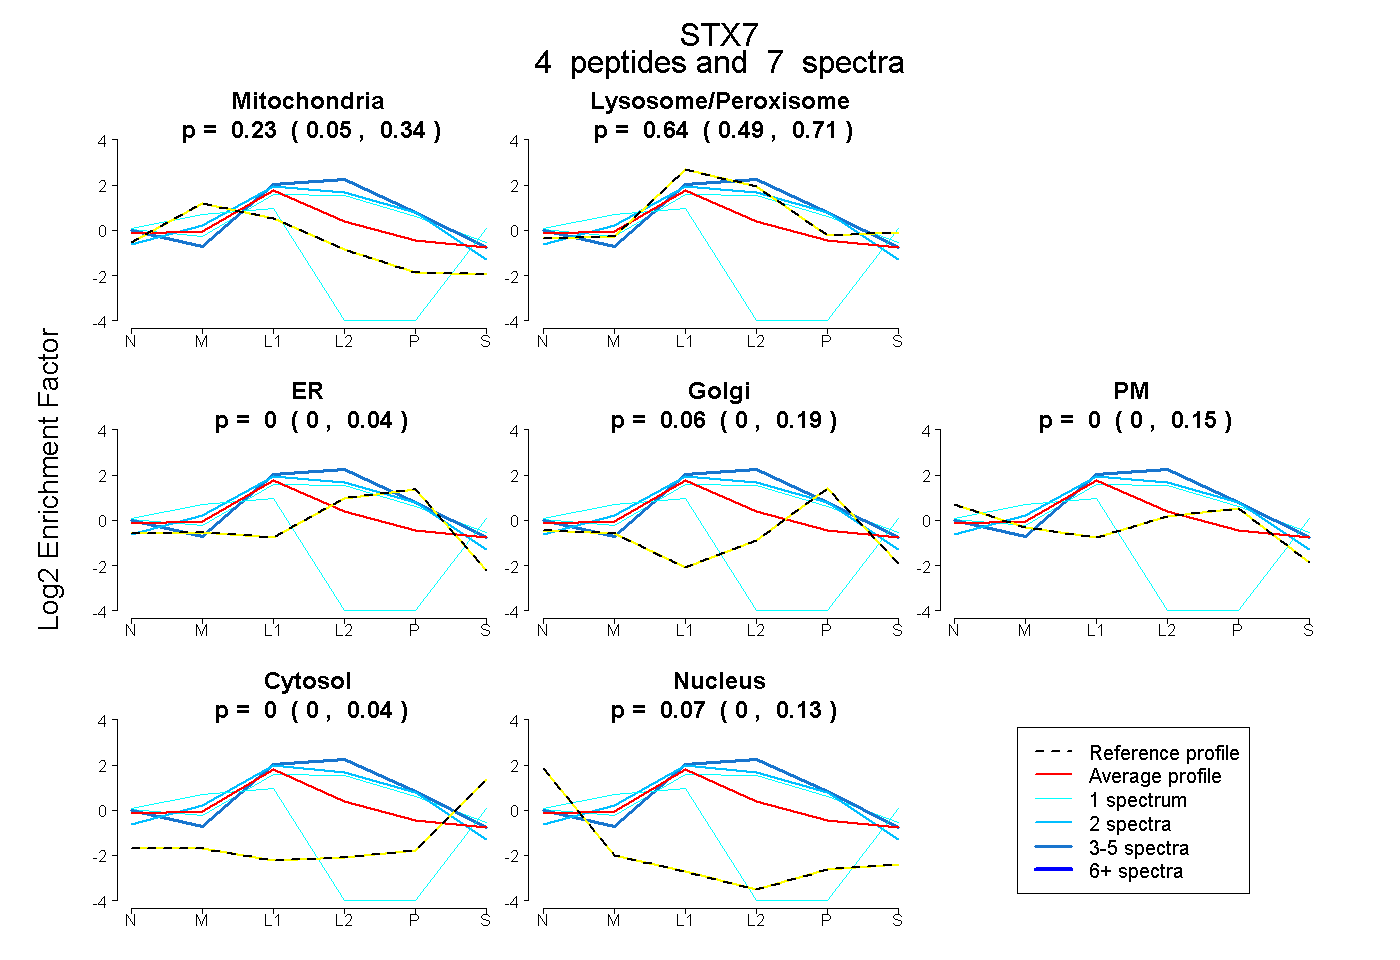 |
0.226 0.054 | 0.342 |
0.637 0.493 | 0.714 |
0.000 0.000 | 0.037 |
0.063 0.000 | 0.192 |
0.000 0.000 | 0.153 |
0.000 0.000 | 0.037 |
0.074 0.000 | 0.126 |
|||
| Plot | Lyso | Other | |||||||||||
| Expt C |
8 peptides |
37 spectra |
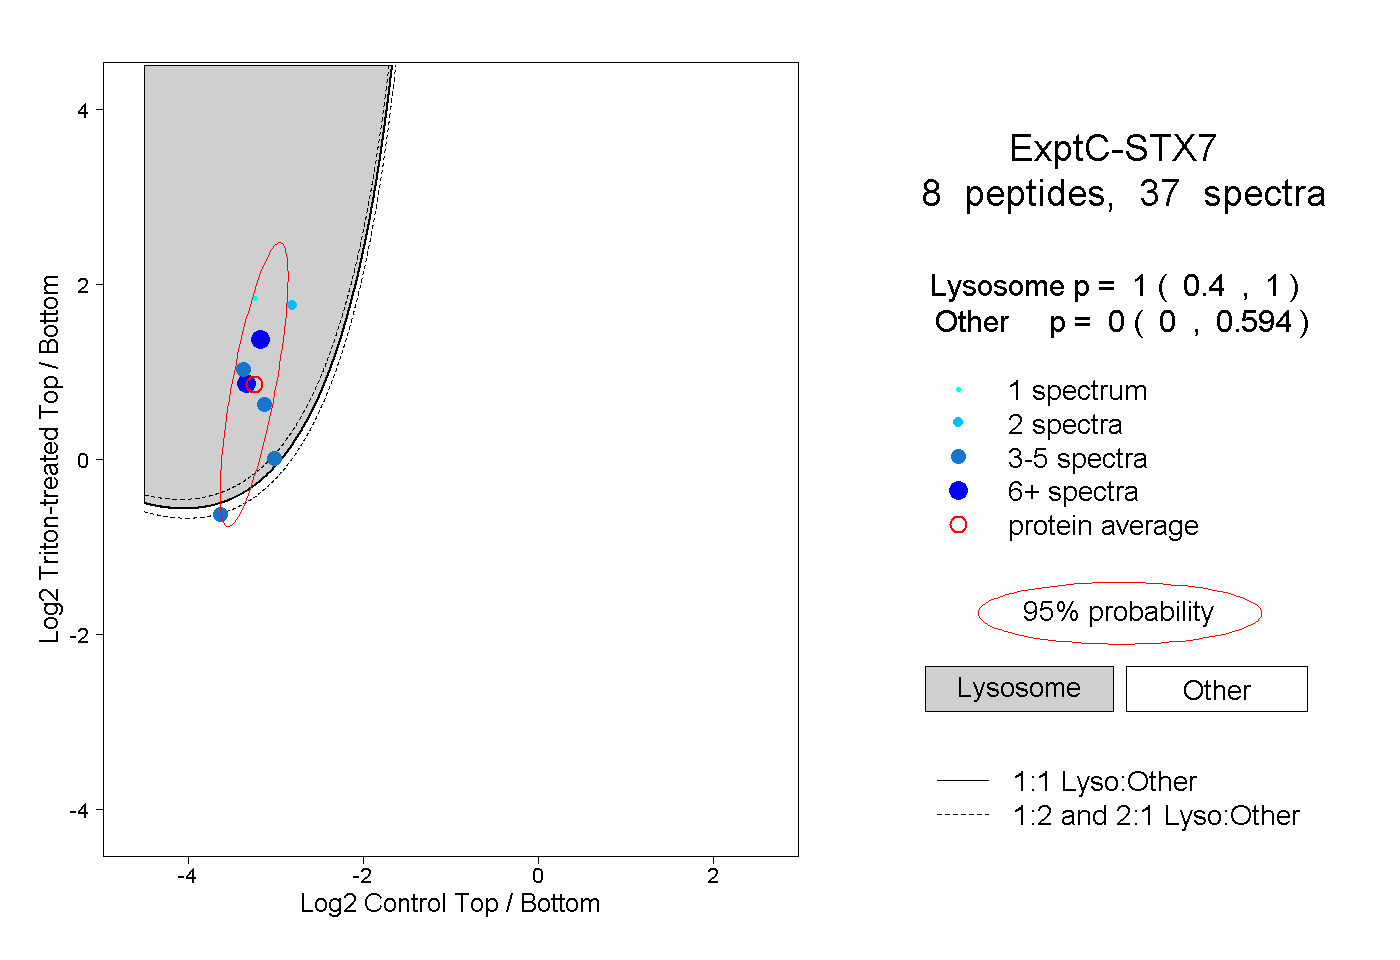 |
1.000 0.400 | 1.000 |
0.000 0.000 | 0.594 |
||||||||
| Plot | Lyso | Other | |||||||||||
| Expt D |
3 peptides |
3 spectra |
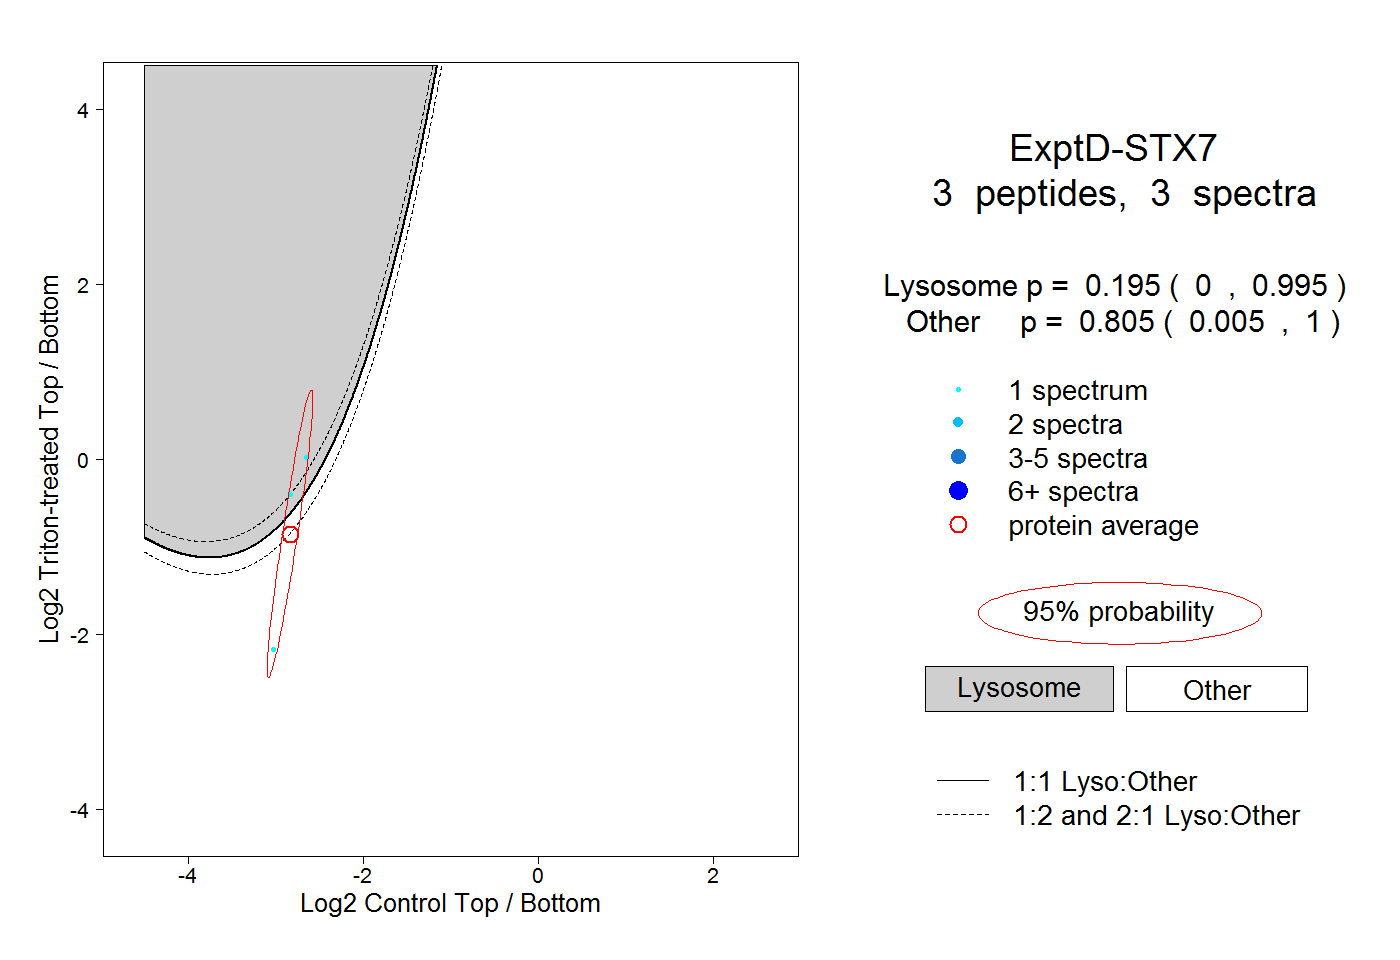 |
0.195 0.000 | 0.995 |
0.805 0.005 | 1.000 |