 8
8peptides
spectra
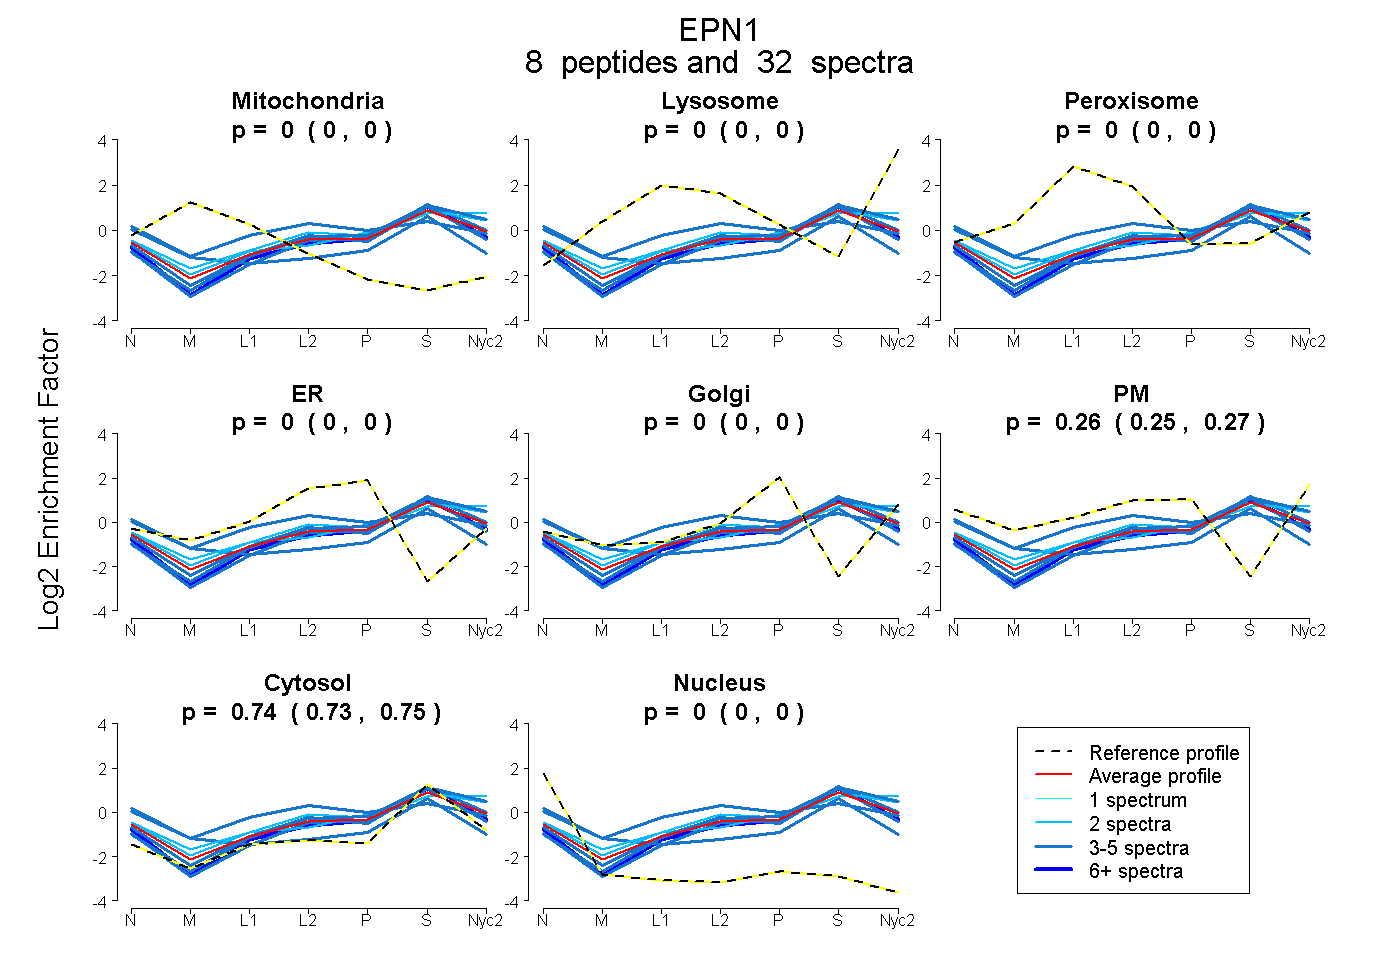
0.000 | 0.000
0.000 | 0.000
0.000 | 0.004
0.000 | 0.004
0.000 | 0.000
0.248 | 0.267
0.731 | 0.747
0.000 | 0.000
3peptides
spectra
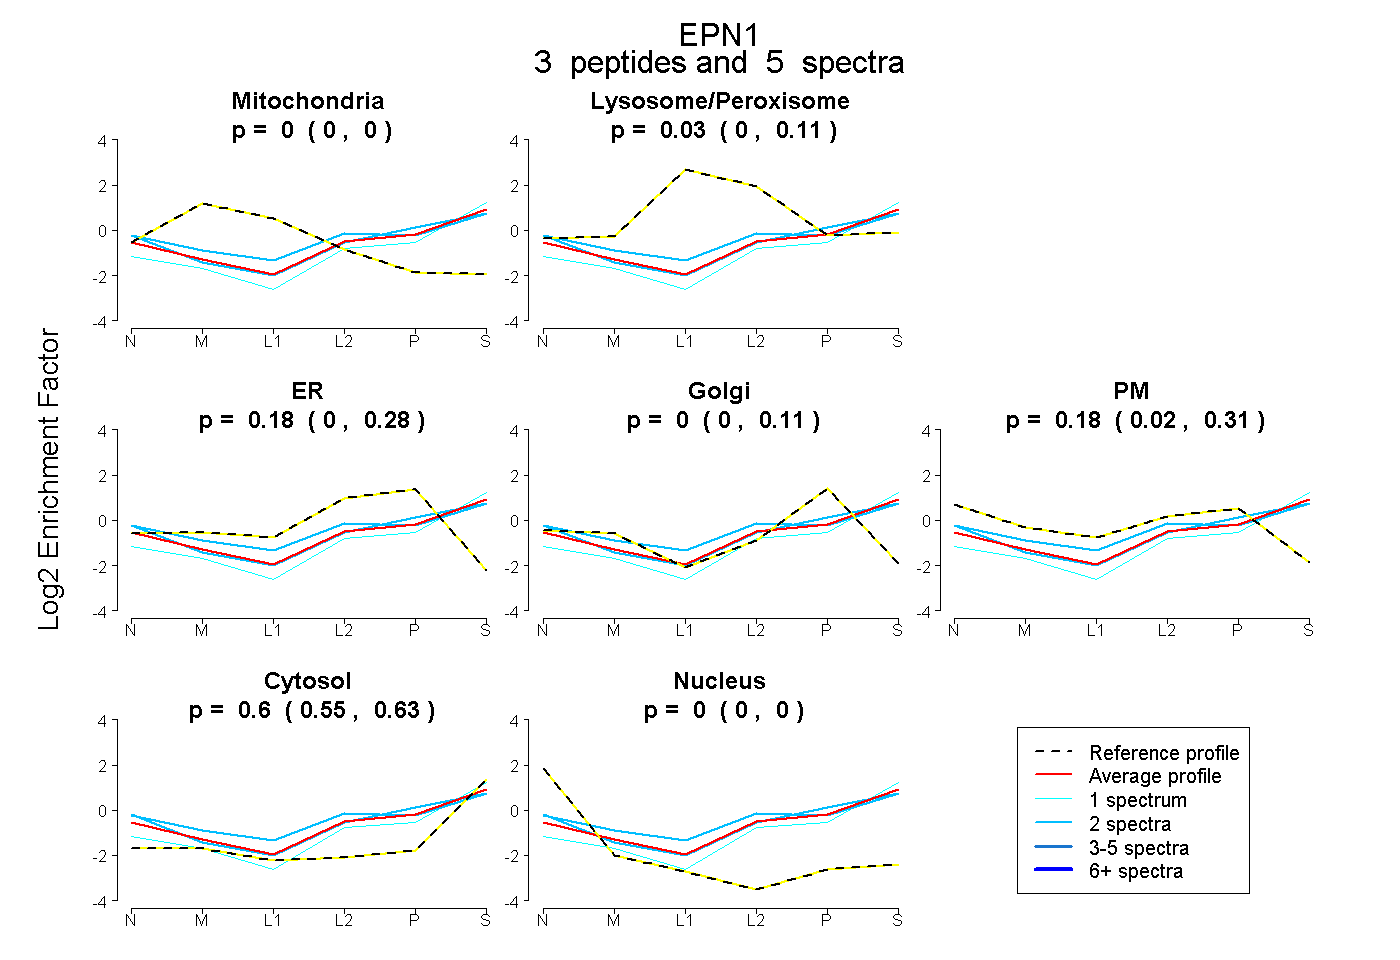
0.000 | 0.000
0.000 | 0.107
0.000 | 0.280
0.000 | 0.112
0.016 | 0.309
0.554 | 0.632
0.000 | 0.000
7peptides
spectra
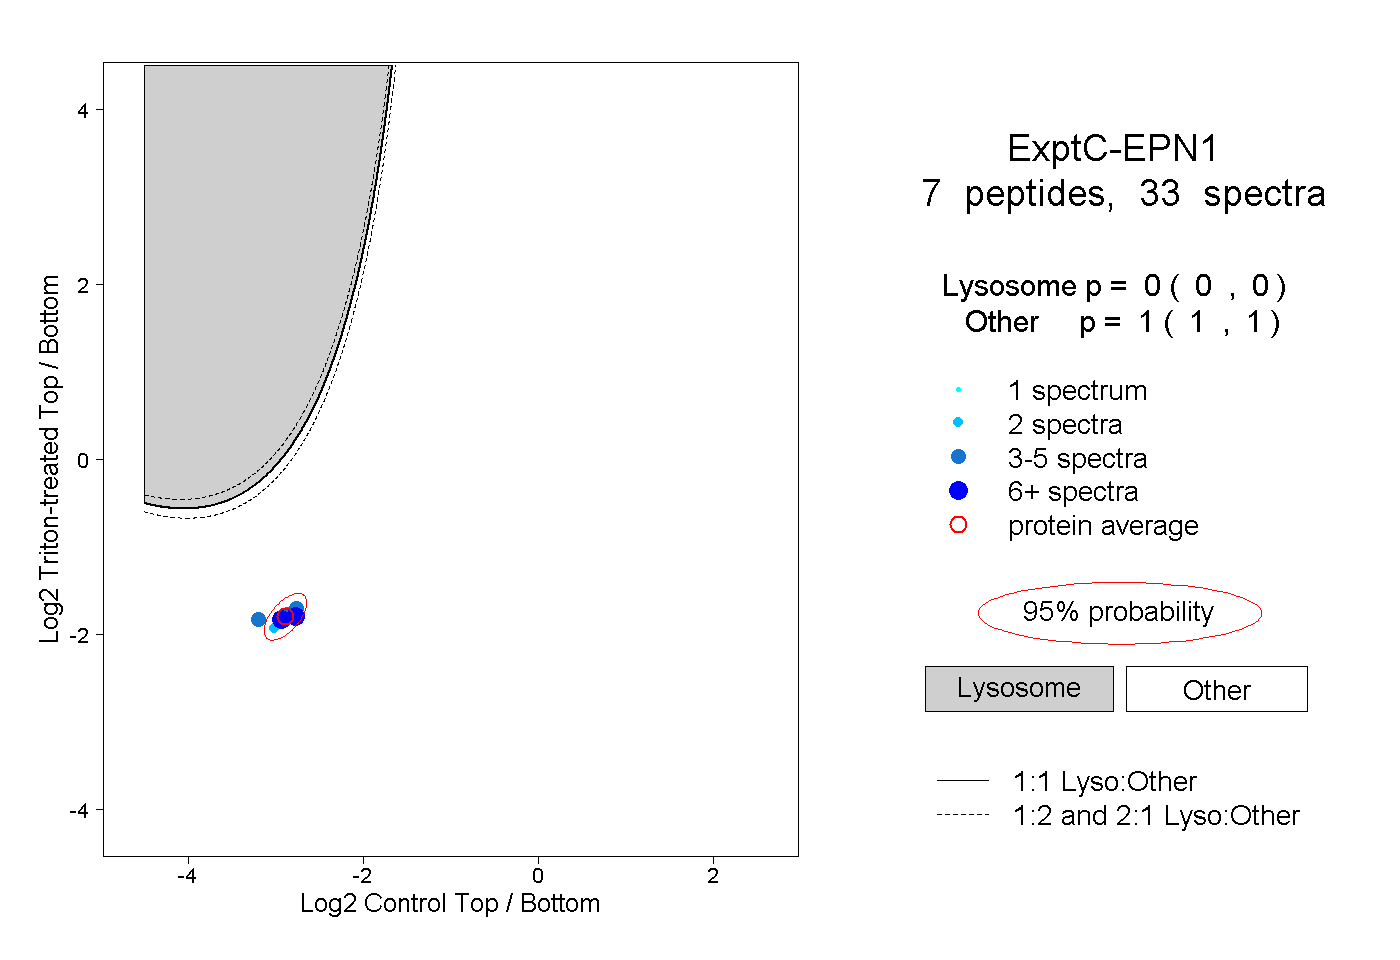
0.000 | 0.000
1.000 | 1.000
1peptide
spectrum
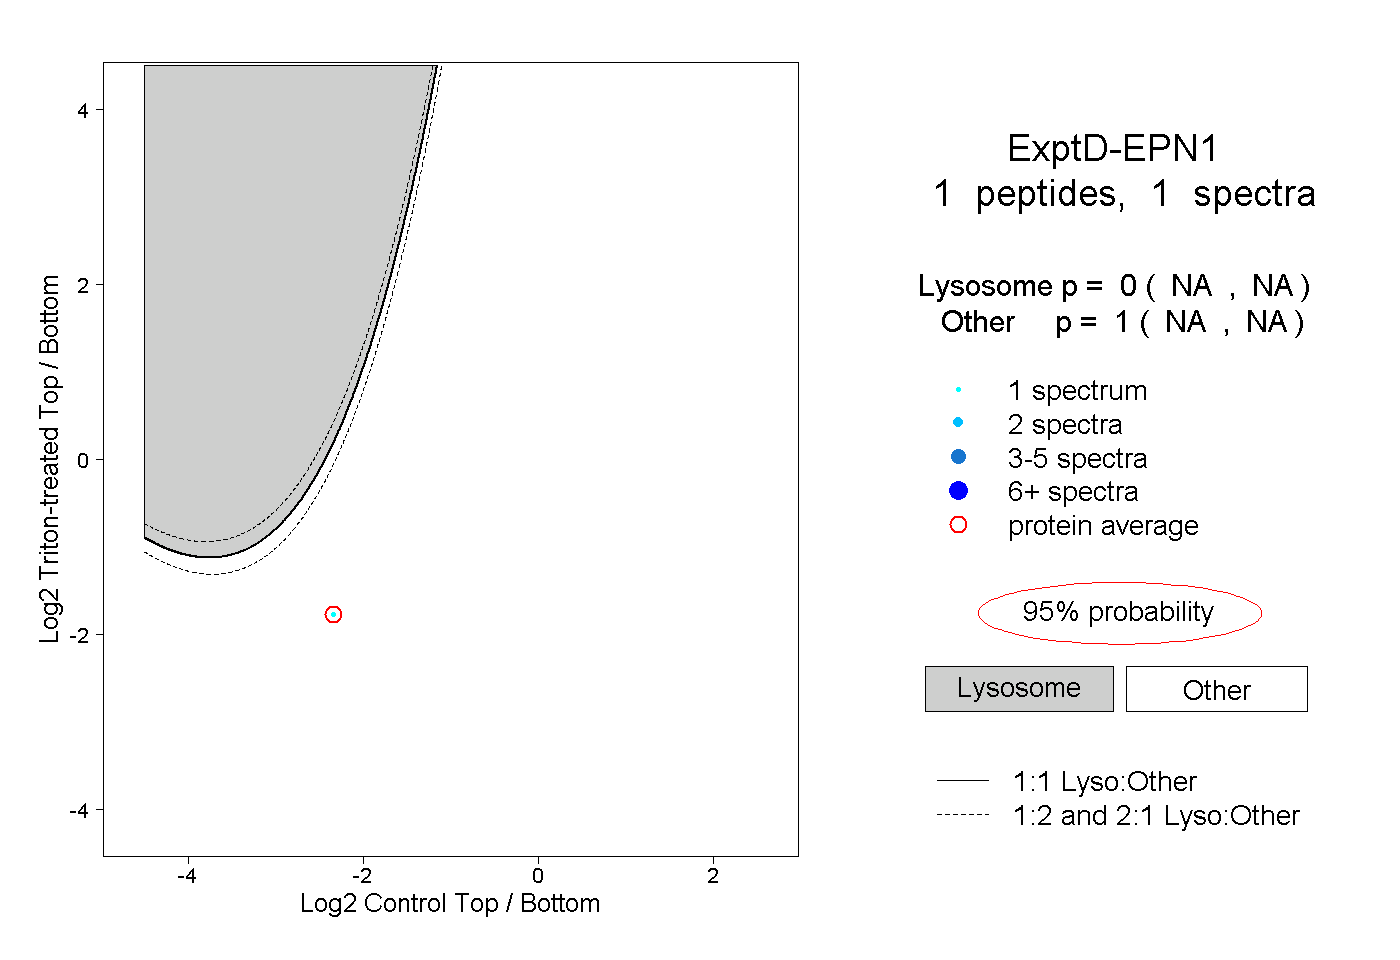
NA | NA
NA | NA