 8
8peptides
spectra
0.000 | 0.000
0.000 | 0.000
0.000 | 0.004
0.000 | 0.004
0.000 | 0.000
0.248 | 0.267
0.731 | 0.747
0.000 | 0.000
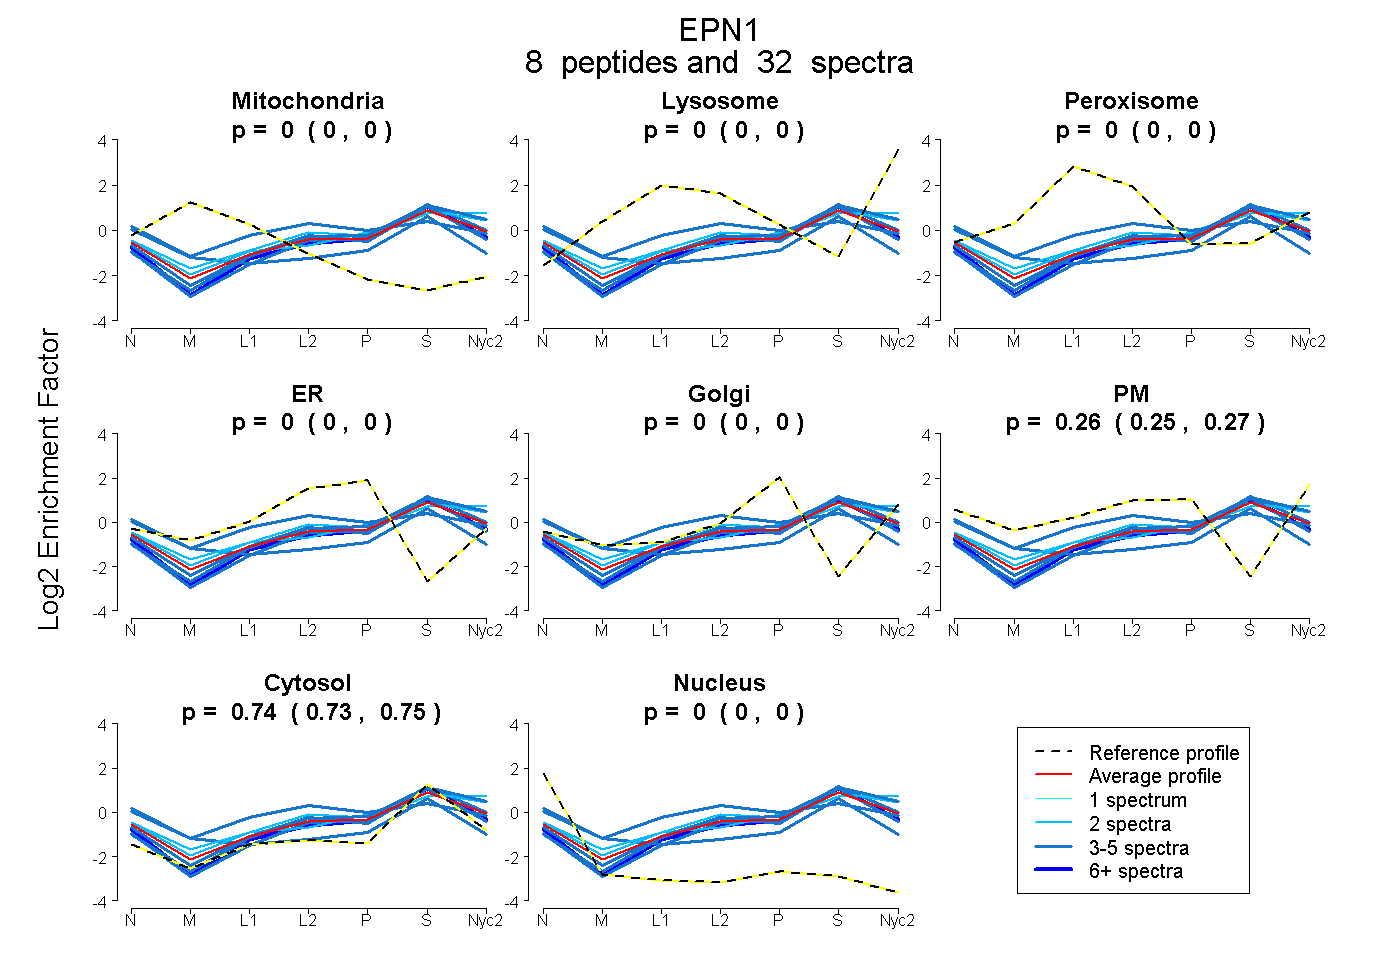
| Plot | Mito | Lyso | Perox | ER | Golgi | PM | Cytosol | Nucleus | |||||
| Expt A |
8 peptides |
32 spectra |
|
0.000 0.000 | 0.000 |
0.000 0.000 | 0.000 |
0.000 0.000 | 0.004 |
0.000 0.000 | 0.004 |
0.000 0.000 | 0.000 |
0.261 0.248 | 0.267 |
0.739 0.731 | 0.747 |
0.000 0.000 | 0.000 |
| 2 spectra, ENMYAVQTLK | 0.000 | 0.051 | 0.000 | 0.000 | 0.020 | 0.238 | 0.690 | 0.000 | ||
| 5 spectra, DFQYVDR | 0.112 | 0.000 | 0.000 | 0.000 | 0.000 | 0.143 | 0.655 | 0.090 | ||
| 2 spectra, LQMAIEESK | 0.000 | 0.119 | 0.000 | 0.000 | 0.000 | 0.260 | 0.621 | 0.000 | ||
| 8 spectra, AMTLMEYLIK | 0.000 | 0.000 | 0.000 | 0.044 | 0.074 | 0.064 | 0.818 | 0.000 | ||
| 4 spectra, VSQQCK | 0.000 | 0.000 | 0.031 | 0.098 | 0.000 | 0.088 | 0.782 | 0.000 | ||
| 4 spectra, QLVALLR | 0.000 | 0.135 | 0.000 | 0.000 | 0.126 | 0.000 | 0.739 | 0.000 | ||
| 4 spectra, DQGVNVR | 0.000 | 0.018 | 0.000 | 0.000 | 0.134 | 0.034 | 0.814 | 0.000 | ||
| 3 spectra, NIVHNYSEAEIK | 0.000 | 0.000 | 0.187 | 0.091 | 0.000 | 0.233 | 0.489 | 0.000 |
| Plot | Mito | Lyso or Perox | ER | Golgi | PM | Cytosol | Nucleus | ||||||
| Expt B |
3 peptides |
5 spectra |
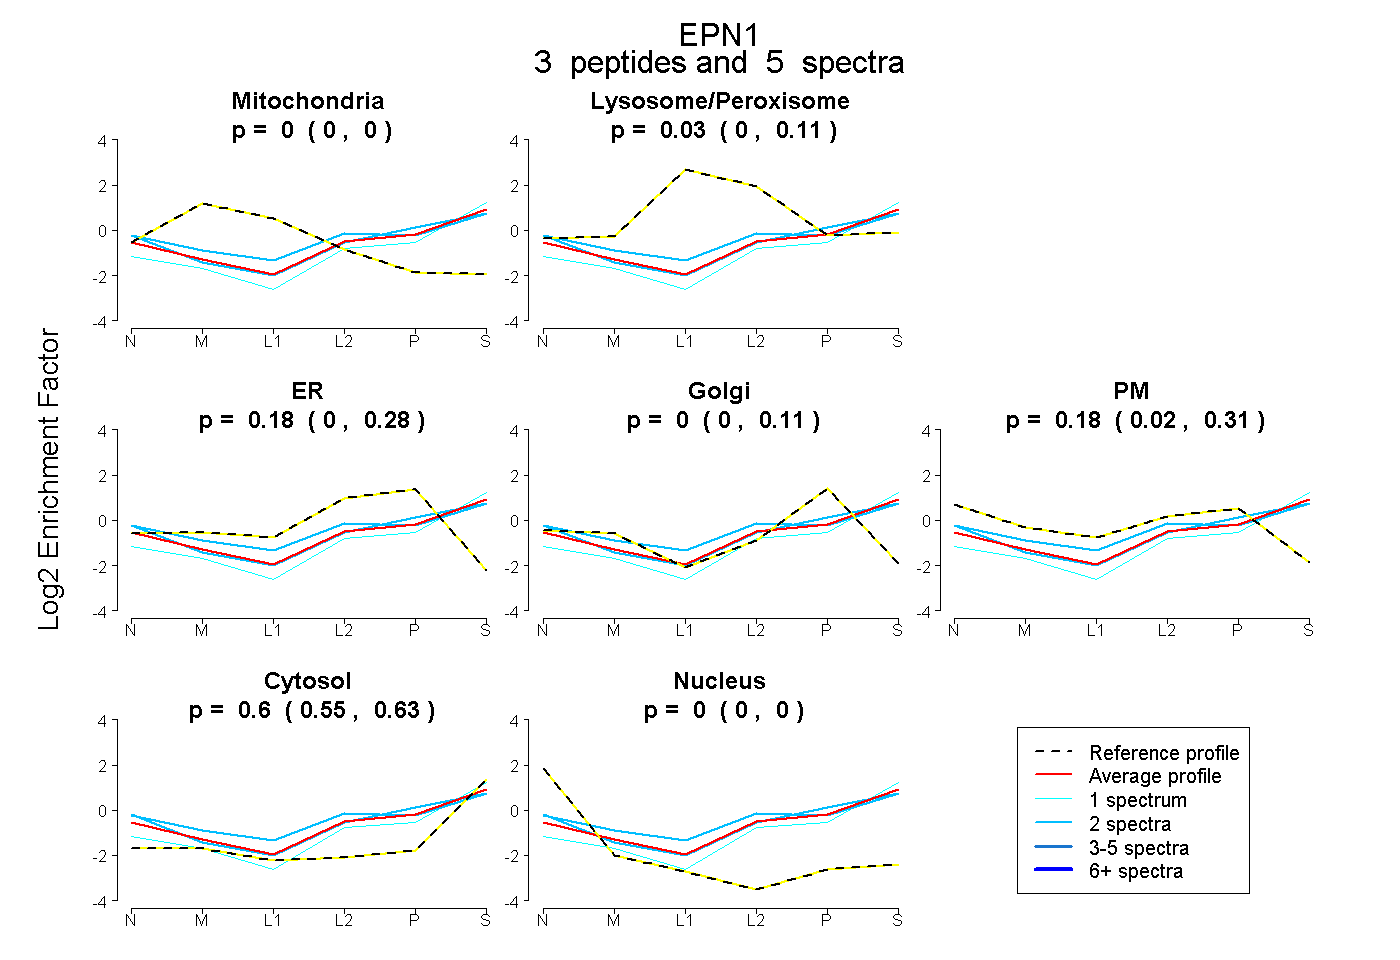 |
0.000 0.000 | 0.000 |
0.032 0.000 | 0.107 |
0.179 0.000 | 0.280 |
0.000 0.000 | 0.112 |
0.185 0.016 | 0.309 |
0.604 0.554 | 0.632 |
0.000 0.000 | 0.000 |
|||
| Plot | Lyso | Other | |||||||||||
| Expt C |
7 peptides |
33 spectra |
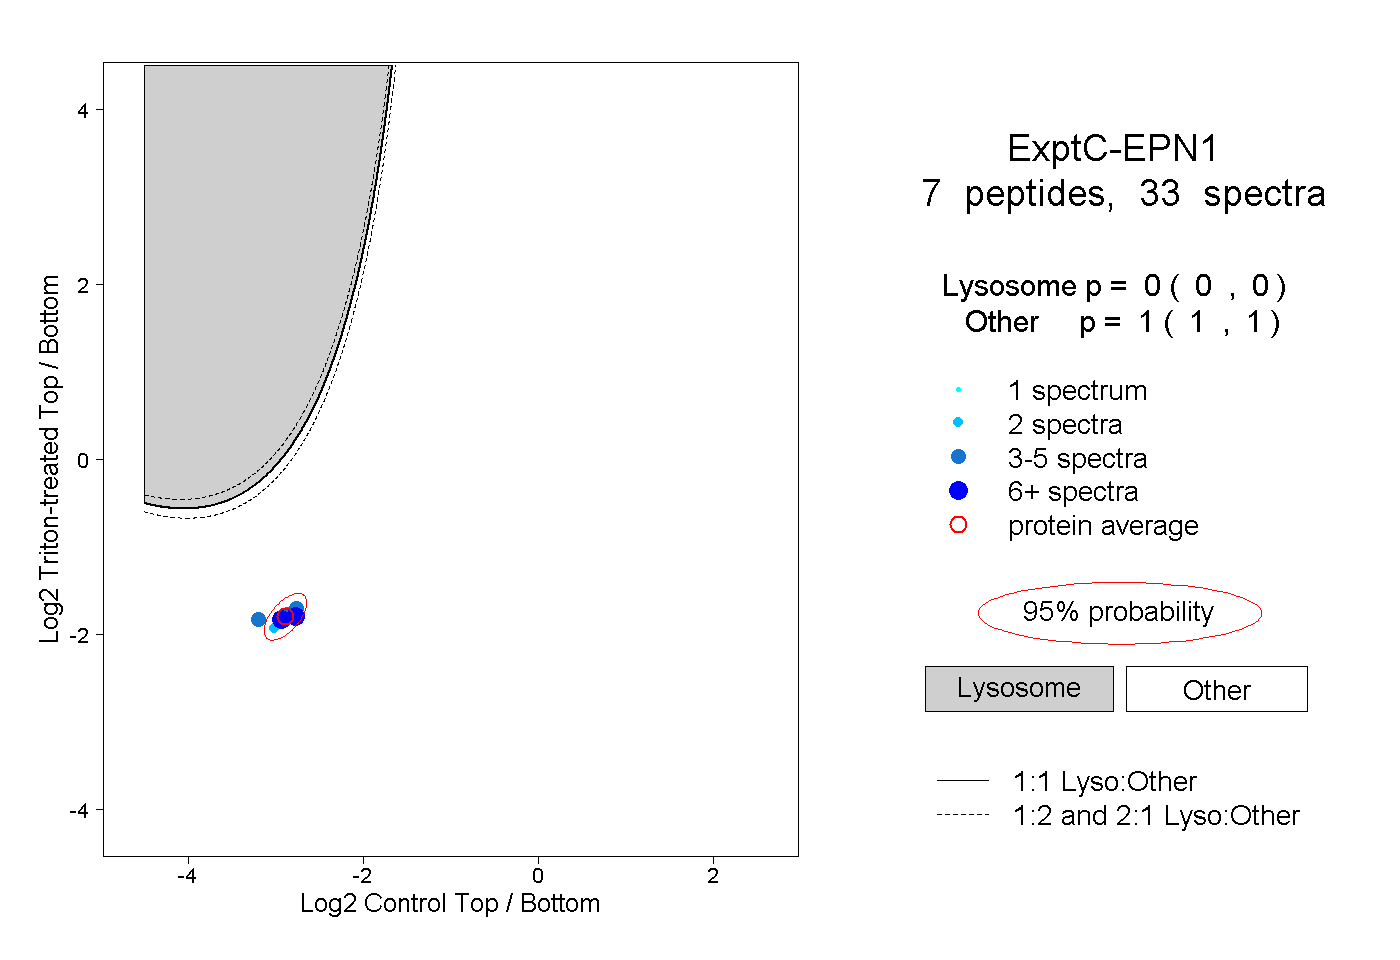 |
0.000 0.000 | 0.000 |
1.000 1.000 | 1.000 |
||||||||
| Plot | Lyso | Other | |||||||||||
| Expt D |
1 peptide |
1 spectrum |
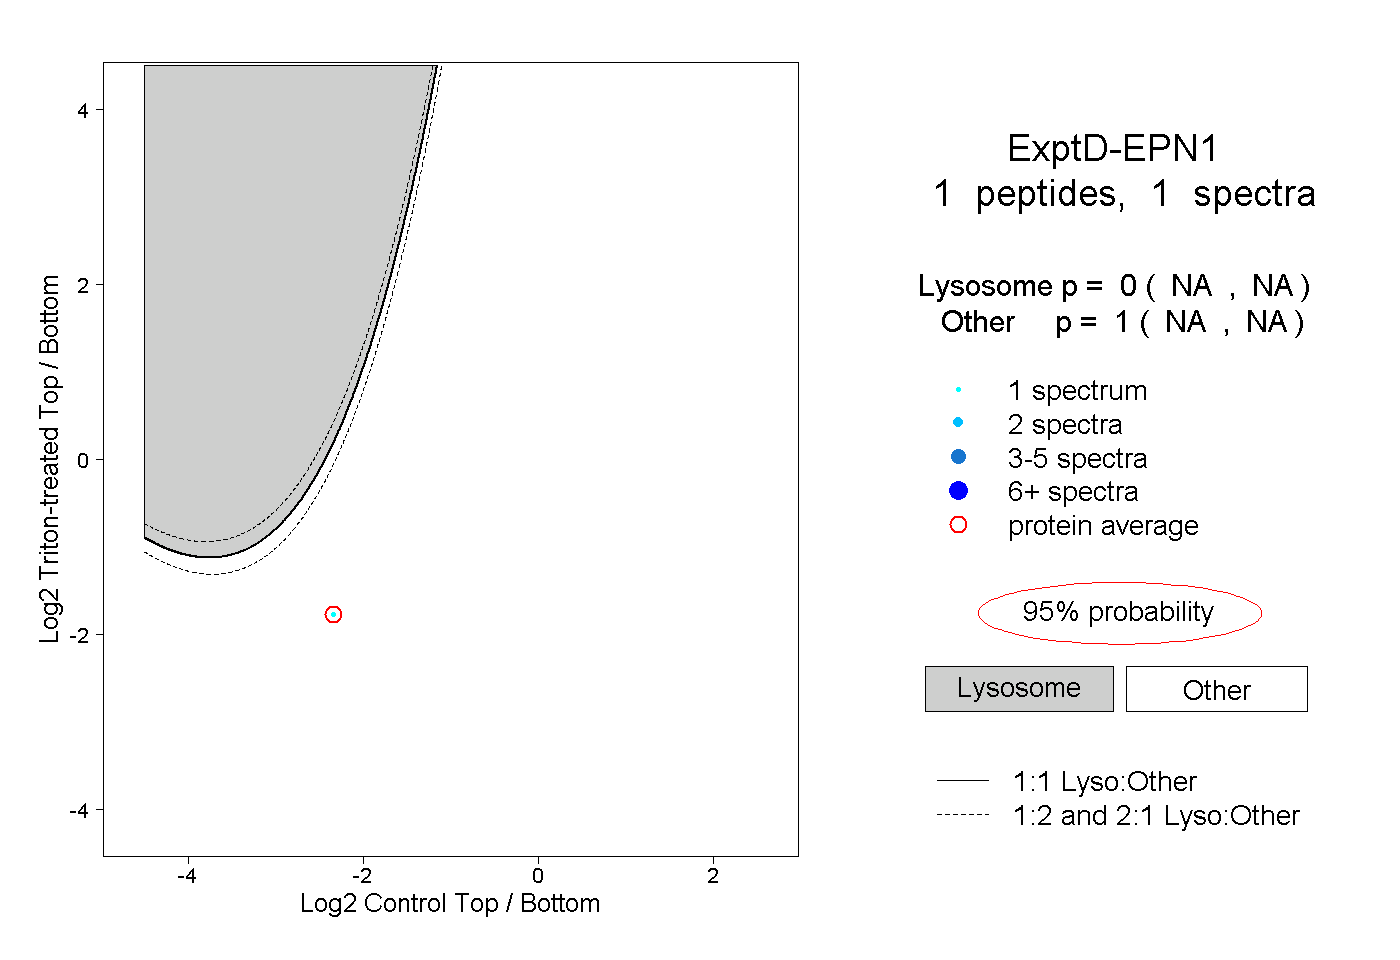 |
0.000 NA | NA |
1.000 NA | NA |