 8
8peptides
spectra
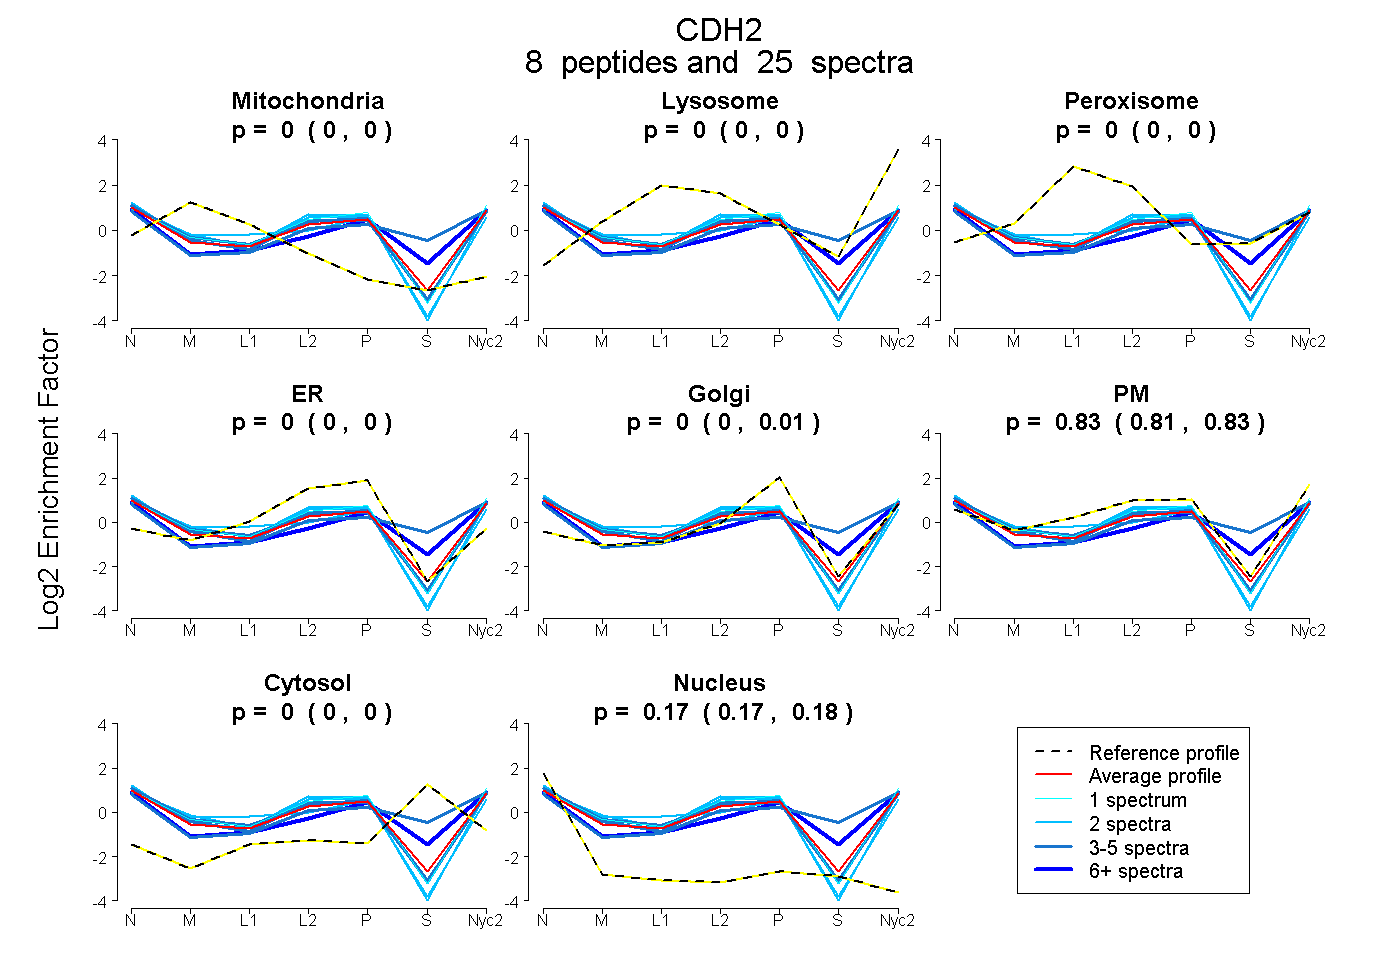
0.000 | 0.000
0.000 | 0.000
0.000 | 0.000
0.000 | 0.000
0.000 | 0.006
0.815 | 0.829
0.000 | 0.000
0.170 | 0.179
3peptides
spectra
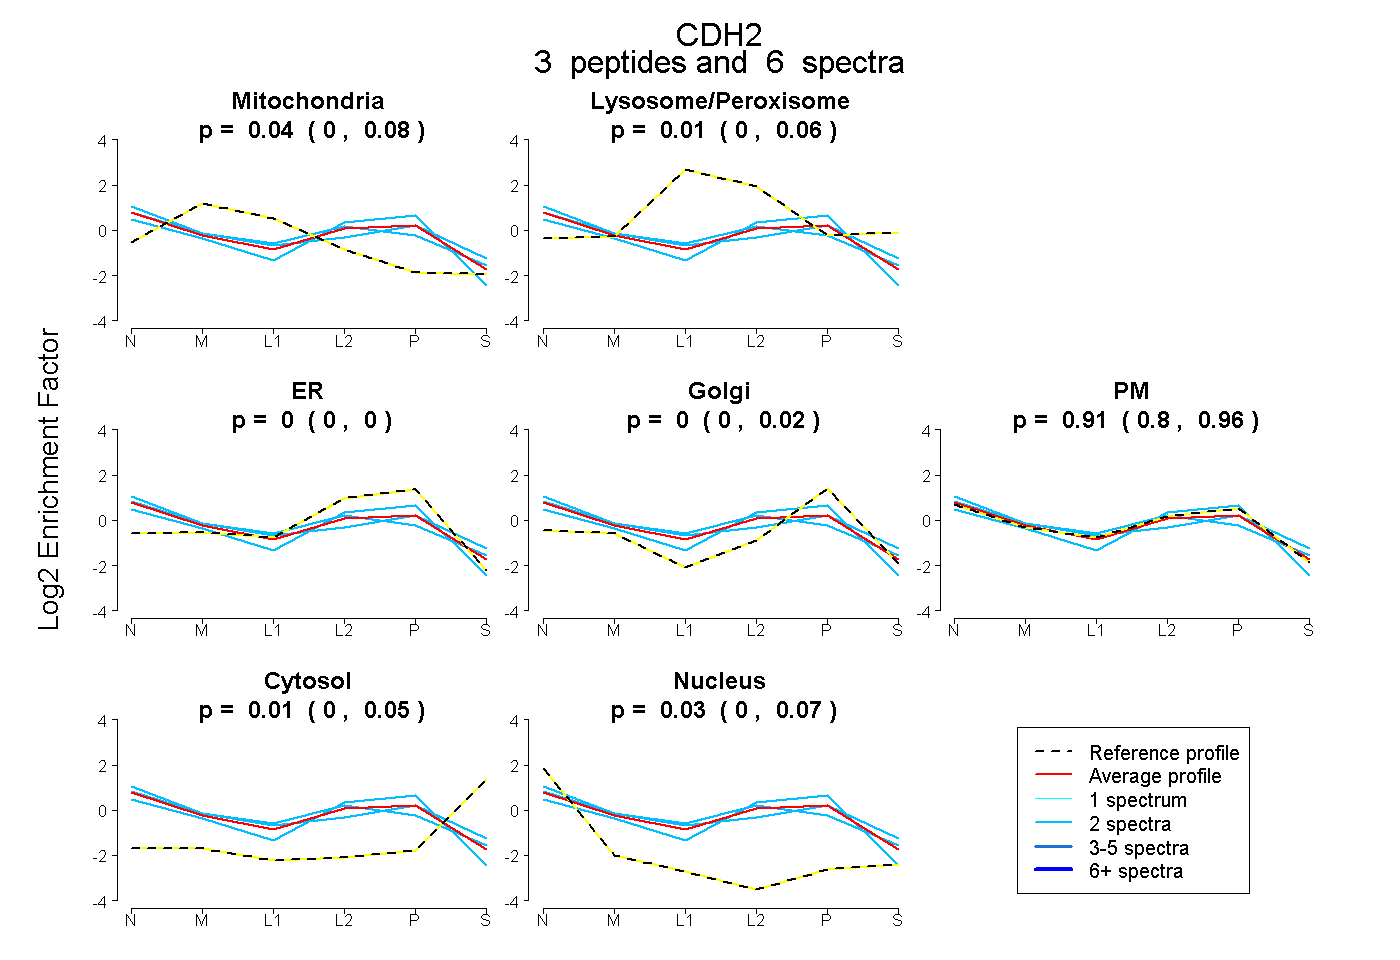
0.000 | 0.081
0.000 | 0.059
0.000 | 0.000
0.000 | 0.015
0.802 | 0.957
0.000 | 0.054
0.000 | 0.074
7peptides
spectra
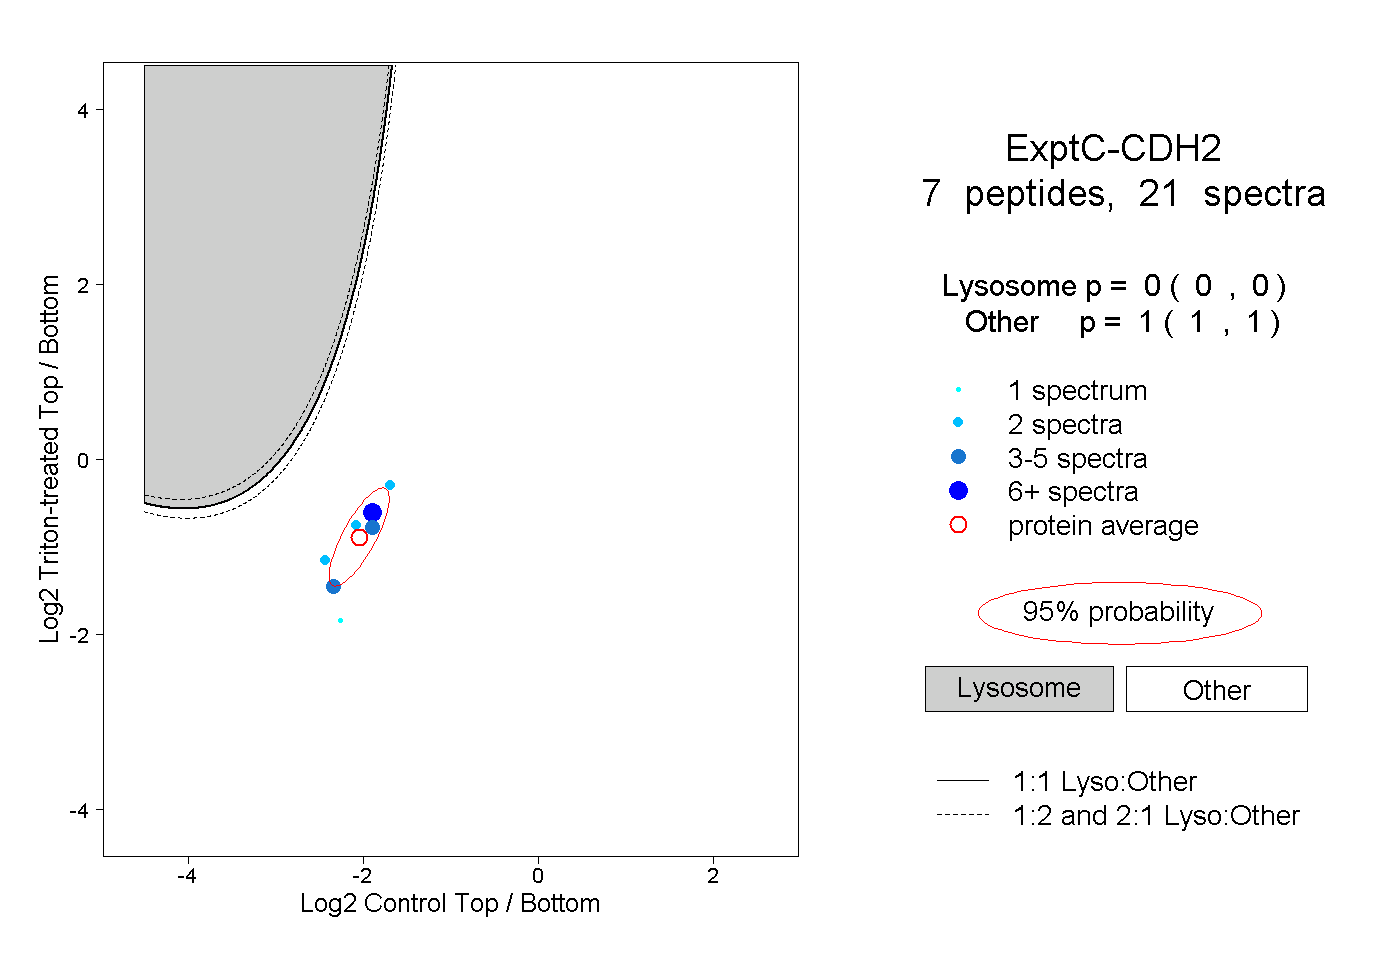
0.000 | 0.000
1.000 | 1.000
4peptides
spectra
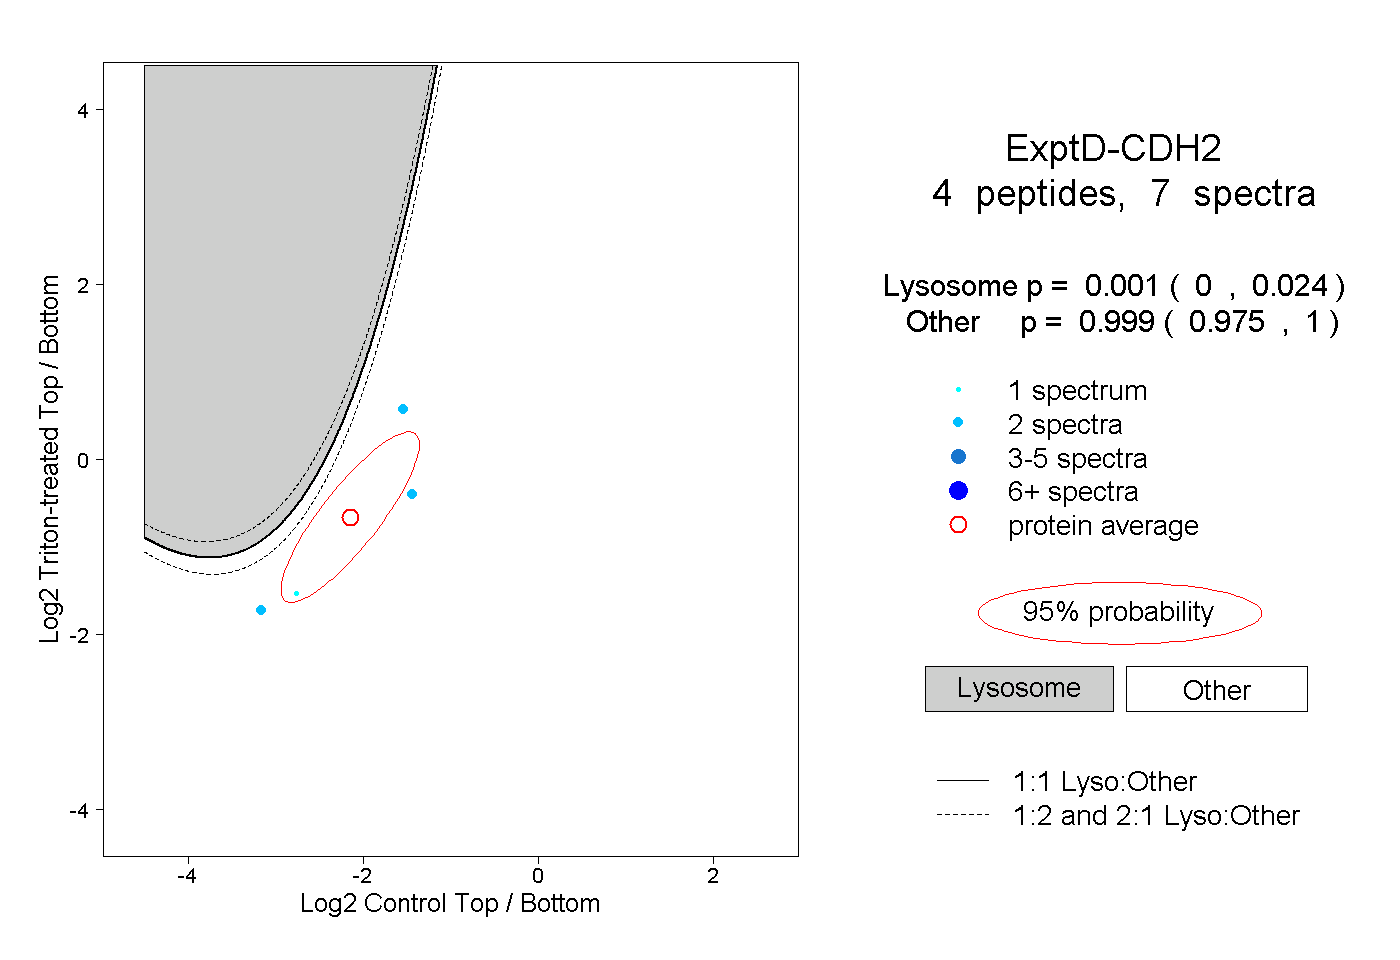
0.000 | 0.024
0.975 | 1.000