 8
8peptides
spectra
0.000 | 0.000
0.000 | 0.000
0.000 | 0.000
0.000 | 0.000
0.000 | 0.006
0.815 | 0.829
0.000 | 0.000
0.170 | 0.179
| Plot | Mito | Lyso | Perox | ER | Golgi | PM | Cytosol | Nucleus | |||||
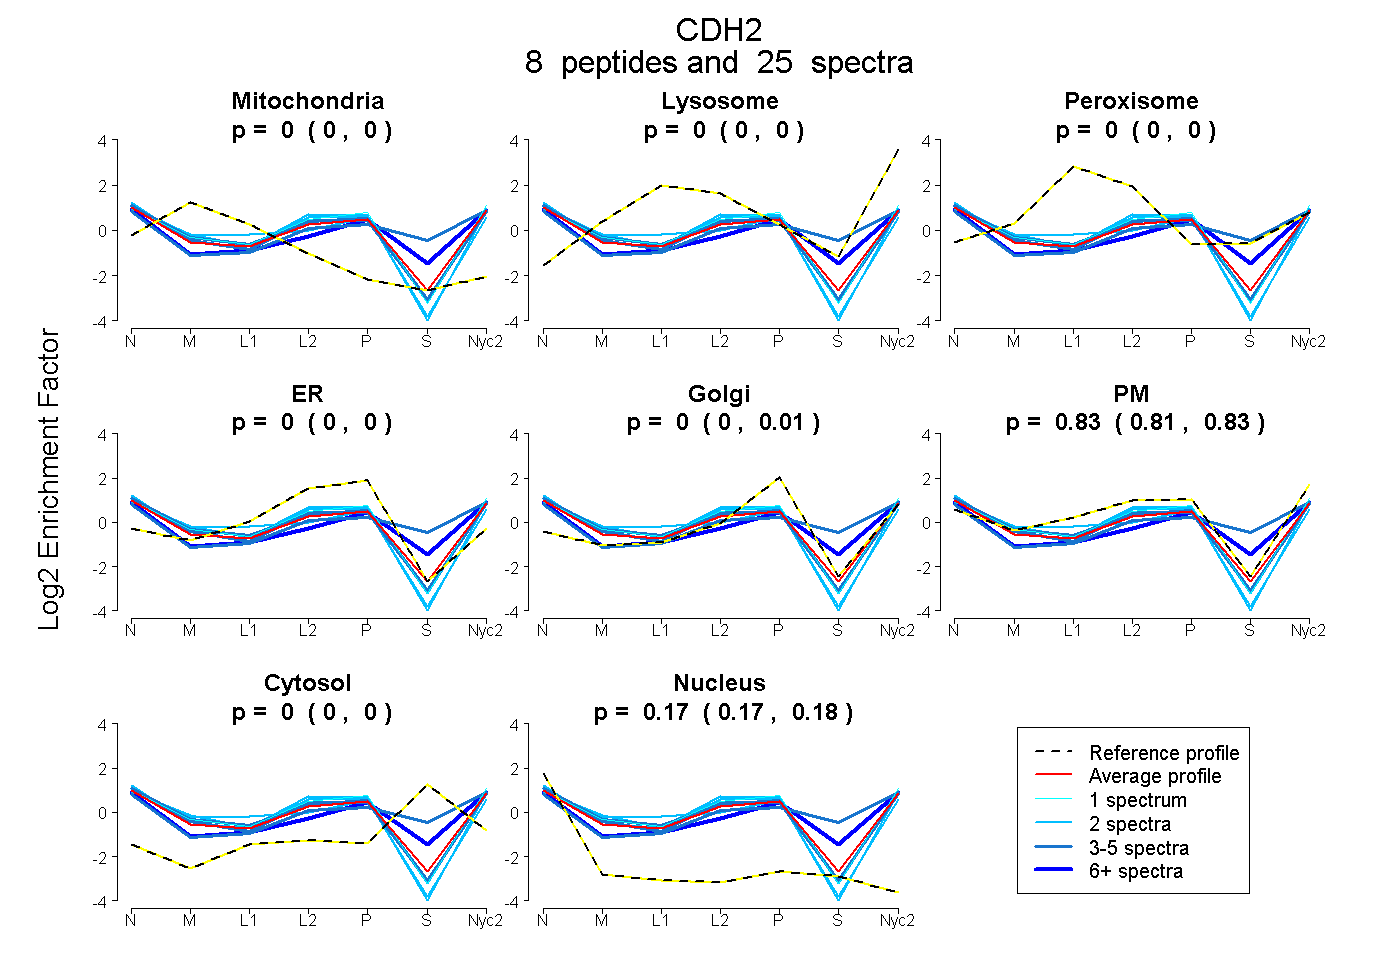
| Expt A |
8 peptides |
25 spectra |
|
0.000 0.000 | 0.000 |
0.000 0.000 | 0.000 |
0.000 0.000 | 0.000 |
0.000 0.000 | 0.000 |
0.000 0.000 | 0.006 |
0.825 0.815 | 0.829 |
0.000 0.000 | 0.000 |
0.175 0.170 | 0.179 |
| 1 spectrum, YMQQNIR | 0.000 | 0.000 | 0.000 | 0.000 | 0.014 | 0.860 | 0.000 | 0.127 | ||
| 3 spectra, QEEGLHAGTMLTTLTAQDPDR | 0.000 | 0.000 | 0.000 | 0.000 | 0.000 | 0.609 | 0.363 | 0.028 | ||
| 2 spectra, ESPNVK | 0.100 | 0.000 | 0.000 | 0.000 | 0.000 | 0.764 | 0.000 | 0.135 | ||
| 2 spectra, FLEAGIYEVPIVITDSGNPPK | 0.000 | 0.000 | 0.000 | 0.009 | 0.000 | 0.828 | 0.000 | 0.163 | ||
| 5 spectra, LSDPANWLK | 0.000 | 0.000 | 0.000 | 0.000 | 0.000 | 0.825 | 0.000 | 0.175 | ||
| 7 spectra, ISGGDPTGR | 0.000 | 0.000 | 0.000 | 0.000 | 0.063 | 0.637 | 0.173 | 0.127 | ||
| 3 spectra, QLLIDPEDDVR | 0.011 | 0.000 | 0.000 | 0.000 | 0.000 | 0.836 | 0.000 | 0.153 | ||
| 2 spectra, LNGDFAQLNLK | 0.016 | 0.000 | 0.000 | 0.010 | 0.000 | 0.856 | 0.000 | 0.118 |
| Plot | Mito | Lyso or Perox | ER | Golgi | PM | Cytosol | Nucleus | ||||||
| Expt B |
3 peptides |
6 spectra |
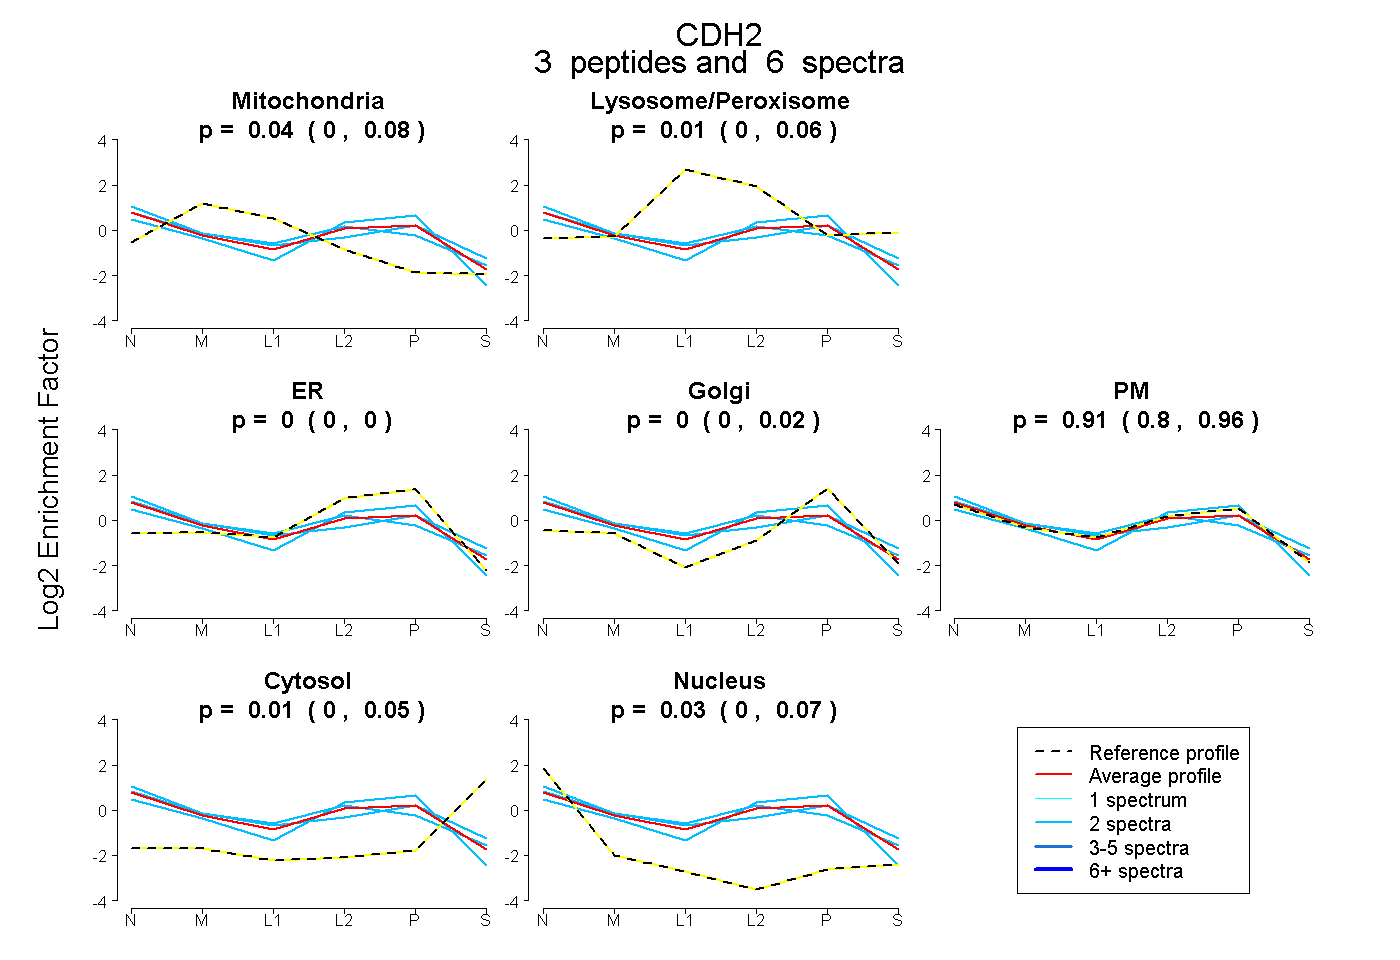 |
0.043 0.000 | 0.081 |
0.006 0.000 | 0.059 |
0.000 0.000 | 0.000 |
0.000 0.000 | 0.015 |
0.908 0.802 | 0.957 |
0.009 0.000 | 0.054 |
0.034 0.000 | 0.074 |
|||
| Plot | Lyso | Other | |||||||||||
| Expt C |
7 peptides |
21 spectra |
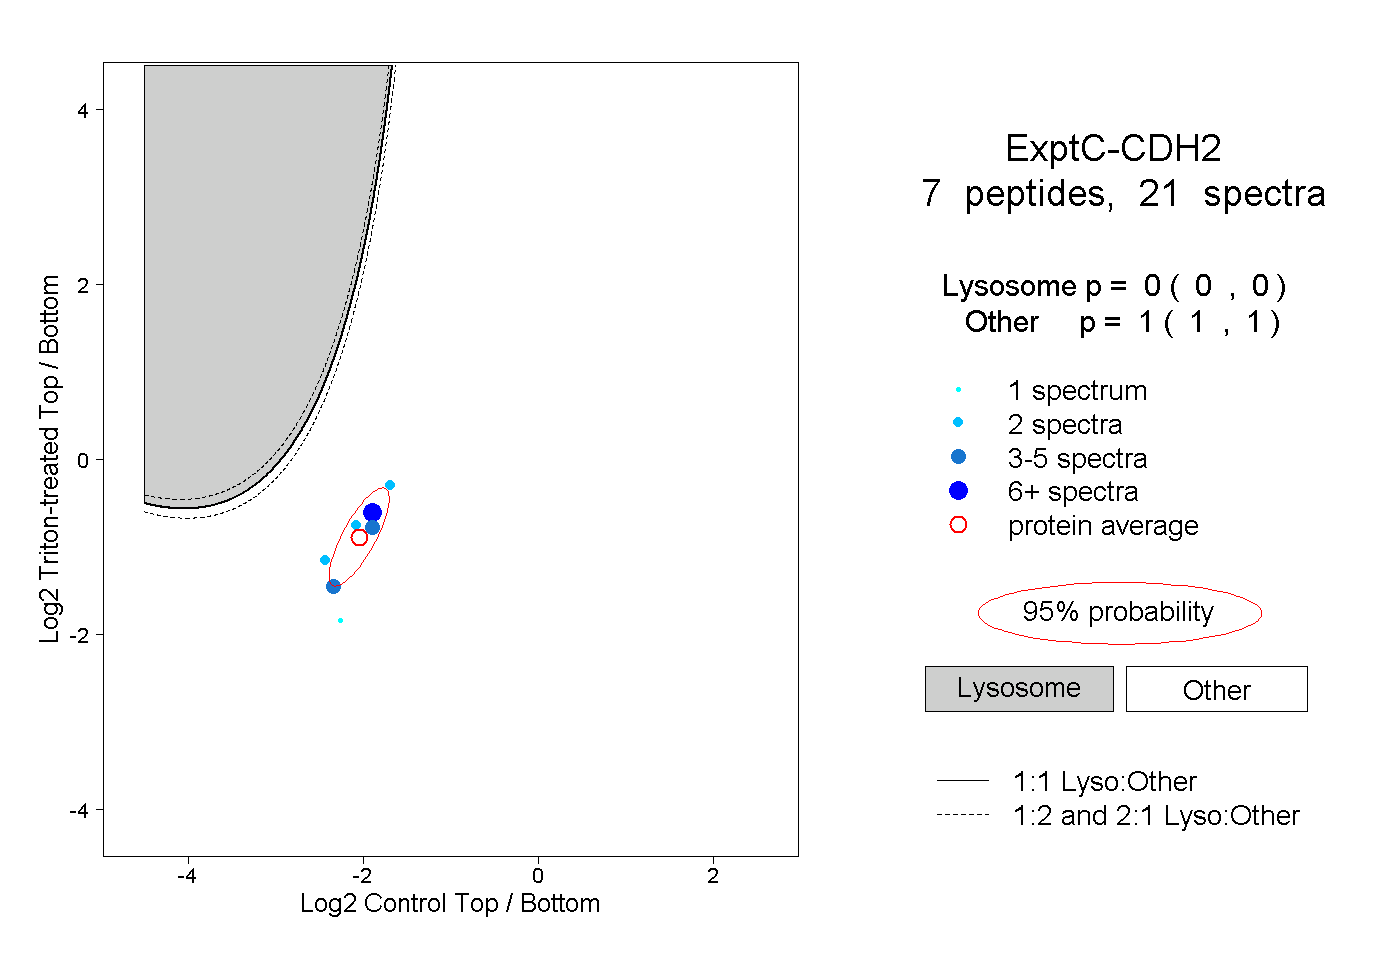 |
0.000 0.000 | 0.000 |
1.000 1.000 | 1.000 |
||||||||
| Plot | Lyso | Other | |||||||||||
| Expt D |
4 peptides |
7 spectra |
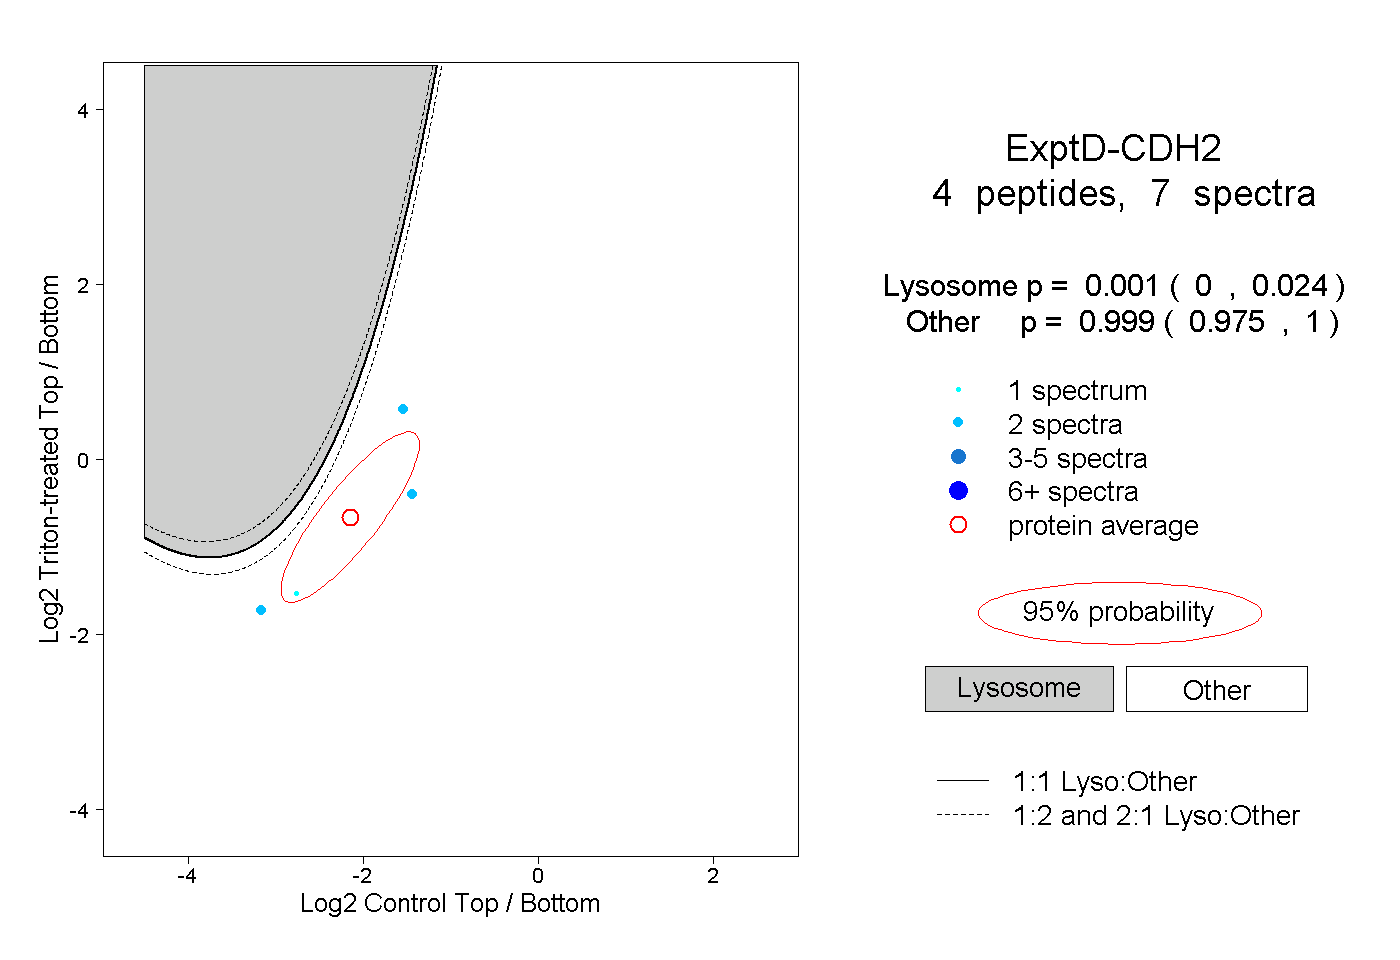 |
0.001 0.000 | 0.024 |
0.999 0.975 | 1.000 |