 6
6peptides
spectra
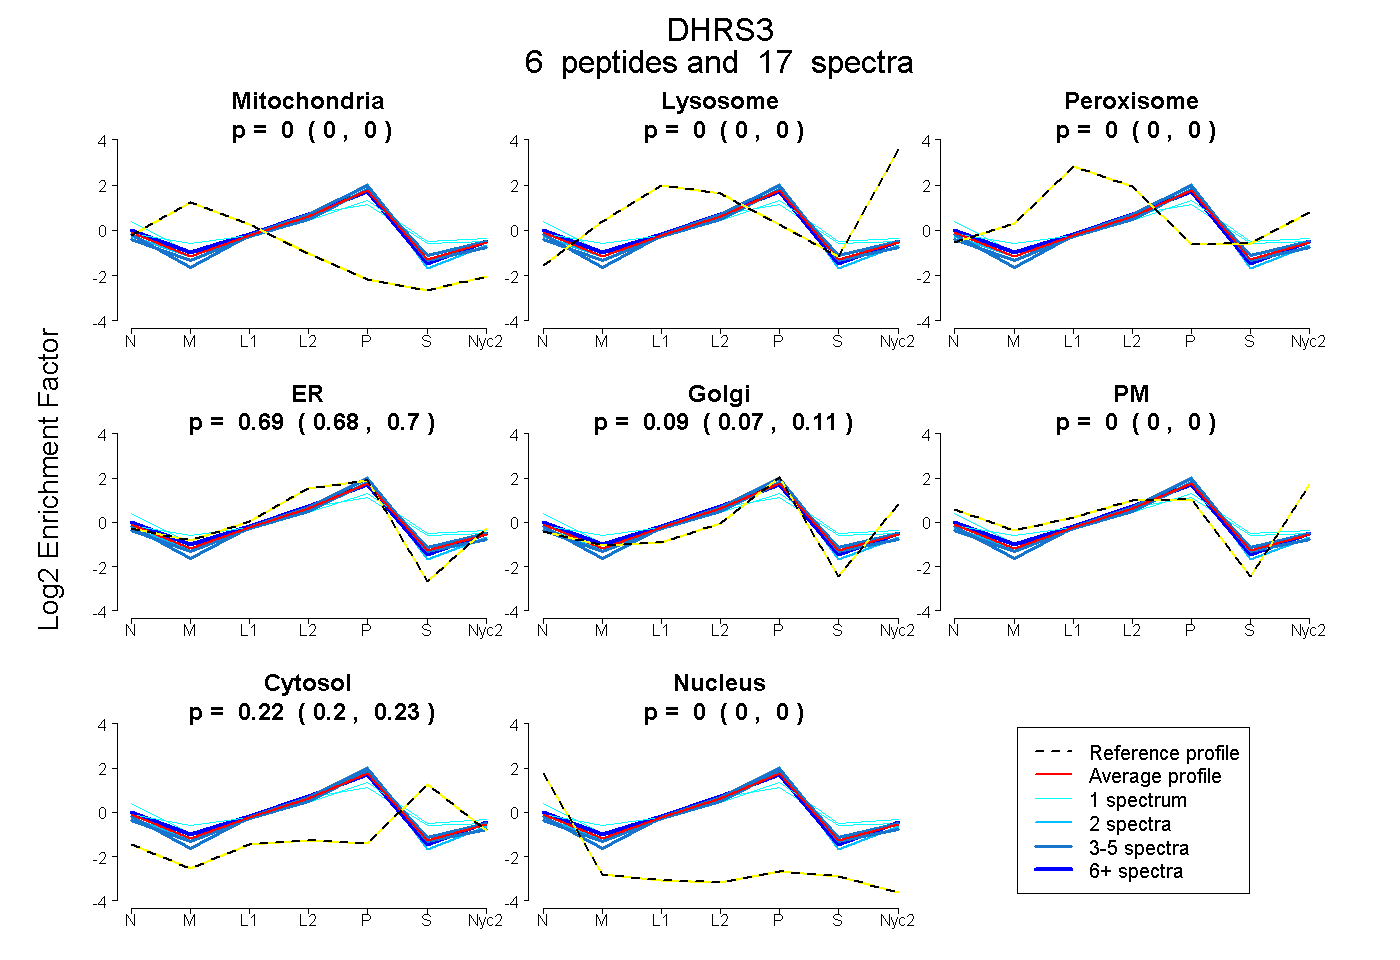
0.000 | 0.000
0.000 | 0.000
0.000 | 0.000
0.679 | 0.704
0.074 | 0.107
0.000 | 0.000
0.205 | 0.226
0.000 | 0.000
3peptides
spectra
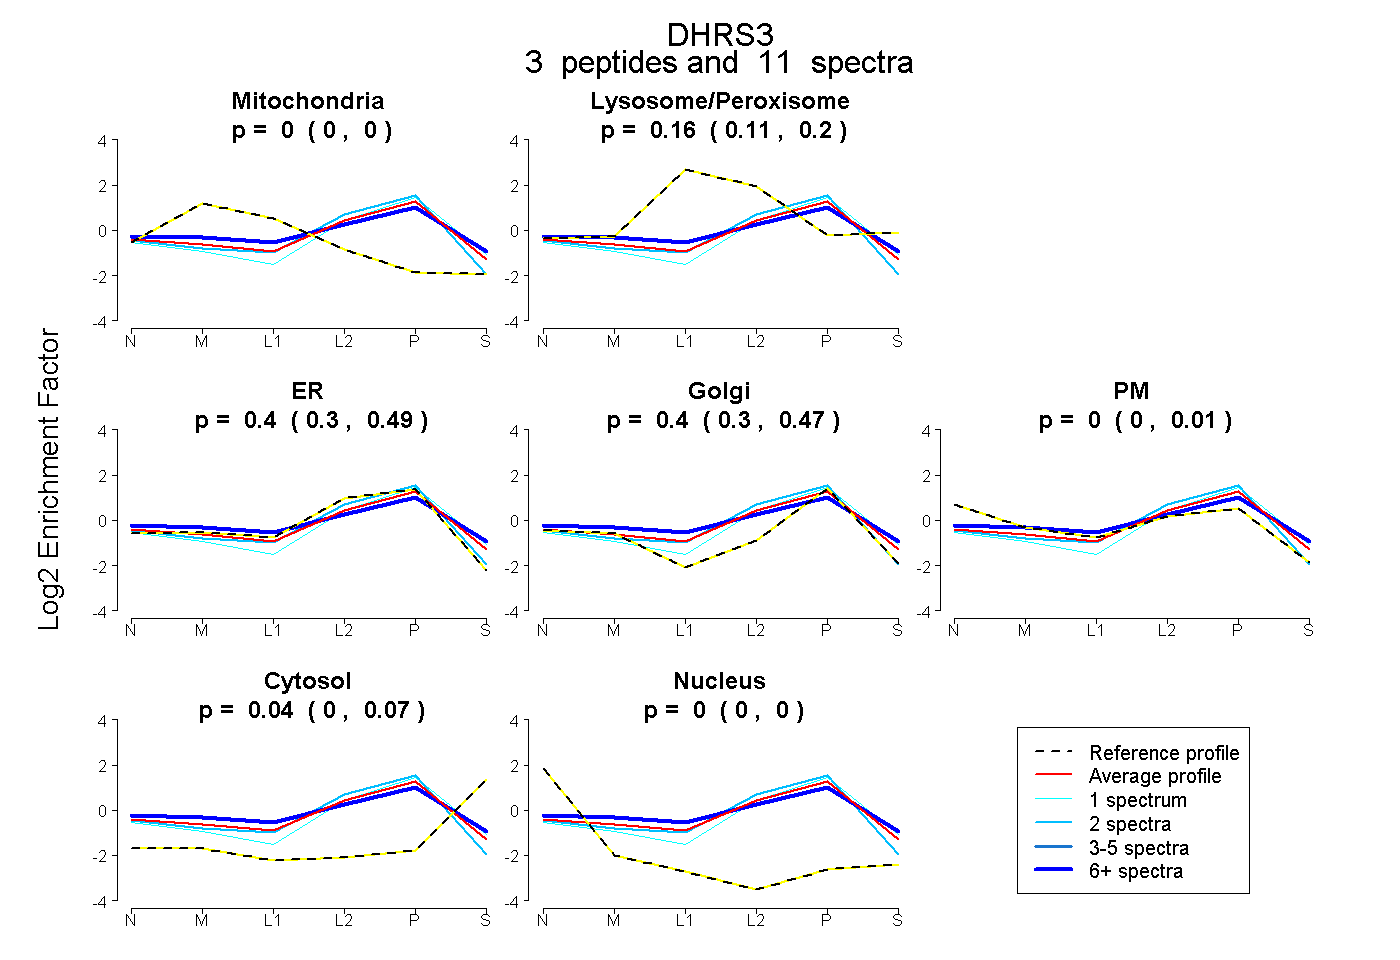
0.000 | 0.000
0.106 | 0.204
0.295 | 0.494
0.304 | 0.472
0.000 | 0.014
0.000 | 0.065
0.000 | 0.000
7peptides
spectra
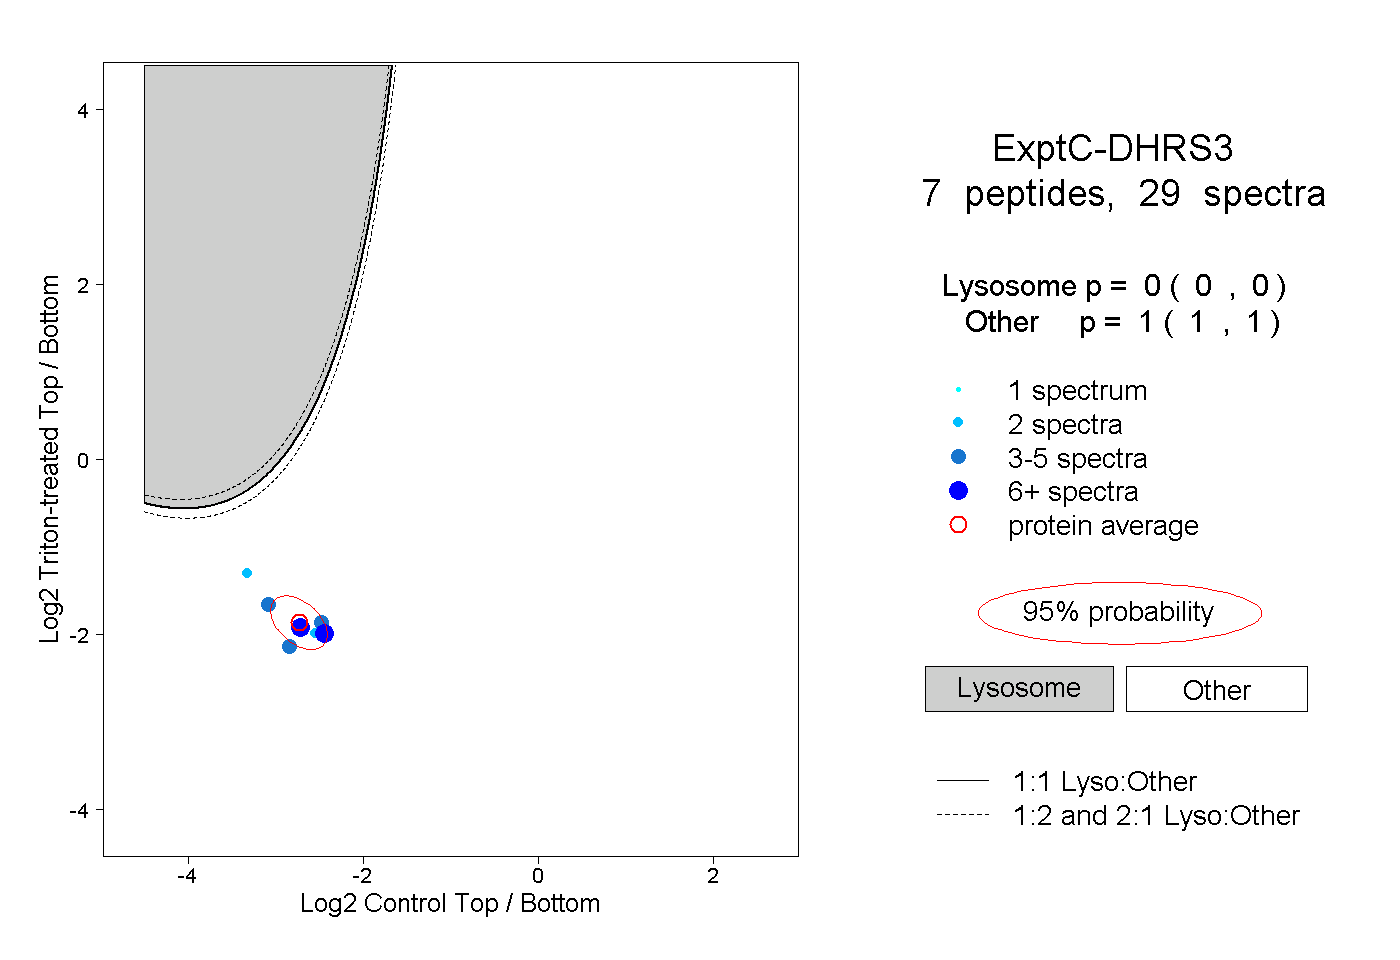
0.000 | 0.000
1.000 | 1.000
2peptides
spectra
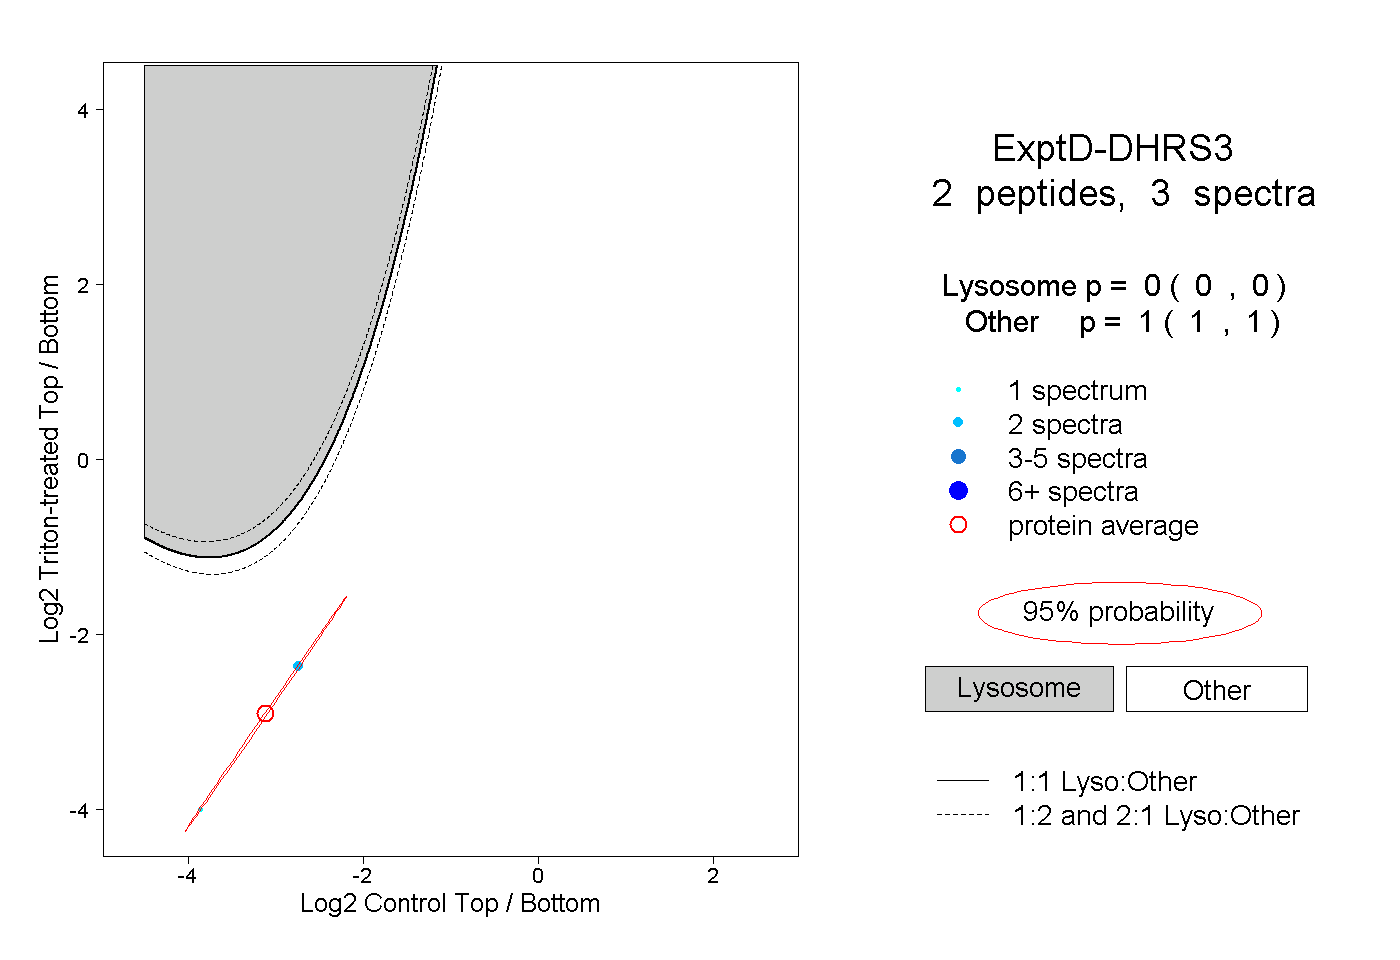
0.000 | 0.000
1.000 | 1.000