 6
6peptides
spectra
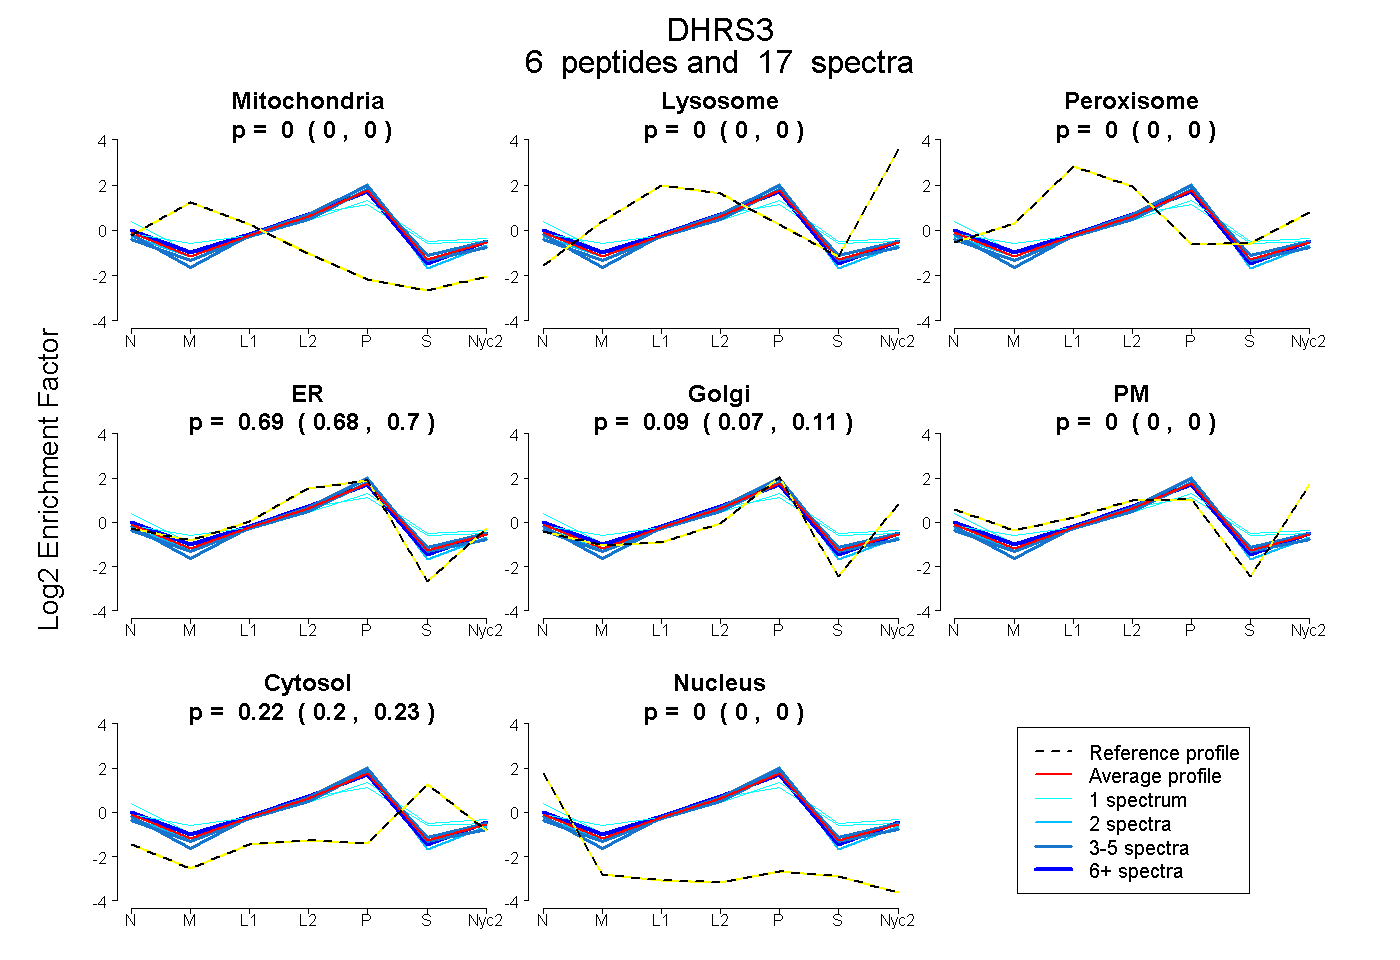
0.000 | 0.000
0.000 | 0.000
0.000 | 0.000
0.679 | 0.704
0.074 | 0.107
0.000 | 0.000
0.205 | 0.226
0.000 | 0.000
| Plot | Mito | Lyso | Perox | ER | Golgi | PM | Cytosol | Nucleus | |||||
| Expt A |
6 peptides |
17 spectra |
|
0.000 0.000 | 0.000 |
0.000 0.000 | 0.000 |
0.000 0.000 | 0.000 |
0.693 0.679 | 0.704 |
0.091 0.074 | 0.107 |
0.000 0.000 | 0.000 |
0.216 0.205 | 0.226 |
0.000 0.000 | 0.000 |
| 4 spectra, SLMDSDDDALLK | 0.000 | 0.000 | 0.000 | 0.610 | 0.147 | 0.000 | 0.244 | 0.000 | ||
| 3 spectra, FPNLFPPLKPETVAR | 0.000 | 0.000 | 0.000 | 0.736 | 0.043 | 0.000 | 0.220 | 0.000 | ||
| 6 spectra, ETTEEIR | 0.000 | 0.000 | 0.002 | 0.719 | 0.096 | 0.000 | 0.183 | 0.000 | ||
| 2 spectra, ESVLITGGGR | 0.000 | 0.000 | 0.000 | 0.719 | 0.126 | 0.000 | 0.153 | 0.002 | ||
| 1 spectrum, AAVGLVLPPK | 0.000 | 0.000 | 0.075 | 0.530 | 0.000 | 0.095 | 0.293 | 0.008 | ||
| 1 spectrum, QMGTECHYFICDVGNR | 0.000 | 0.000 | 0.137 | 0.405 | 0.192 | 0.000 | 0.267 | 0.000 |
| Plot | Mito | Lyso or Perox | ER | Golgi | PM | Cytosol | Nucleus | ||||||
| Expt B |
3 peptides |
11 spectra |
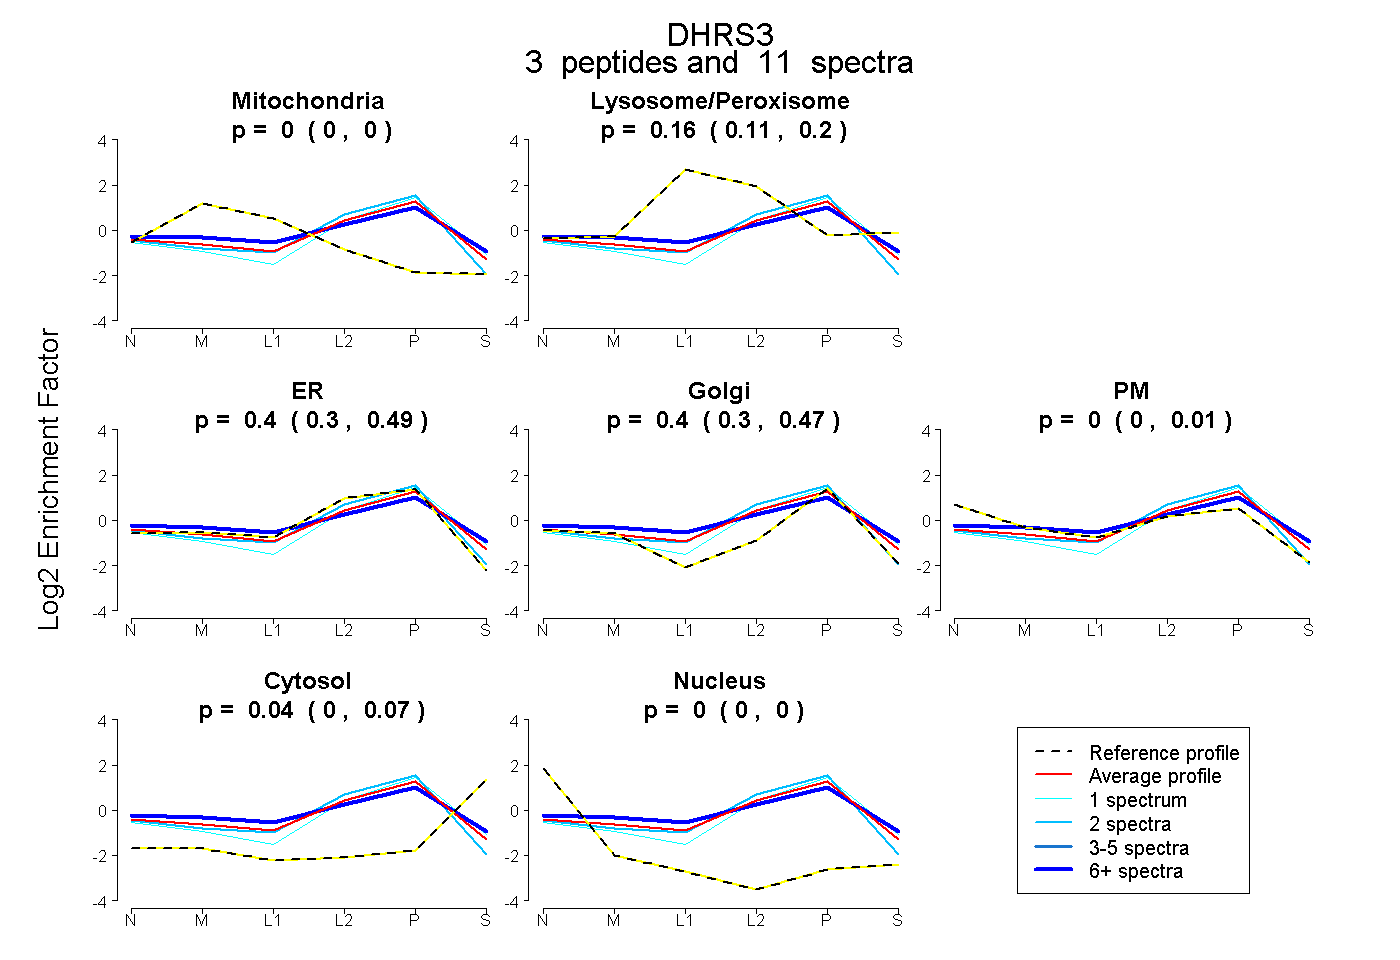 |
0.000 0.000 | 0.000 |
0.161 0.106 | 0.204 |
0.402 0.295 | 0.494 |
0.401 0.304 | 0.472 |
0.000 0.000 | 0.014 |
0.036 0.000 | 0.065 |
0.000 0.000 | 0.000 |
|||
| Plot | Lyso | Other | |||||||||||
| Expt C |
7 peptides |
29 spectra |
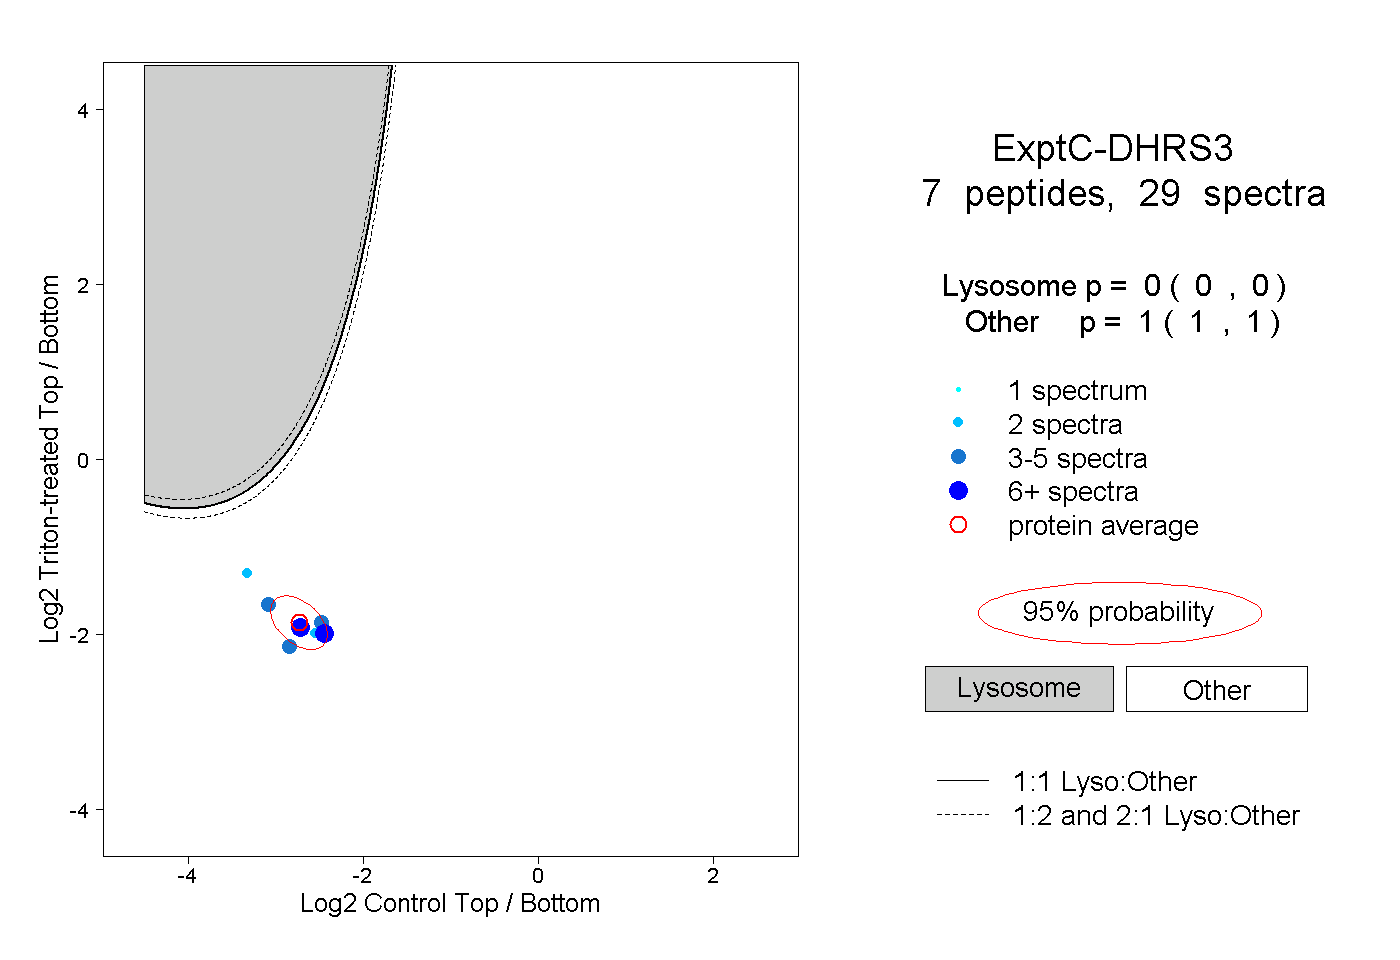 |
0.000 0.000 | 0.000 |
1.000 1.000 | 1.000 |
||||||||
| Plot | Lyso | Other | |||||||||||
| Expt D |
2 peptides |
3 spectra |
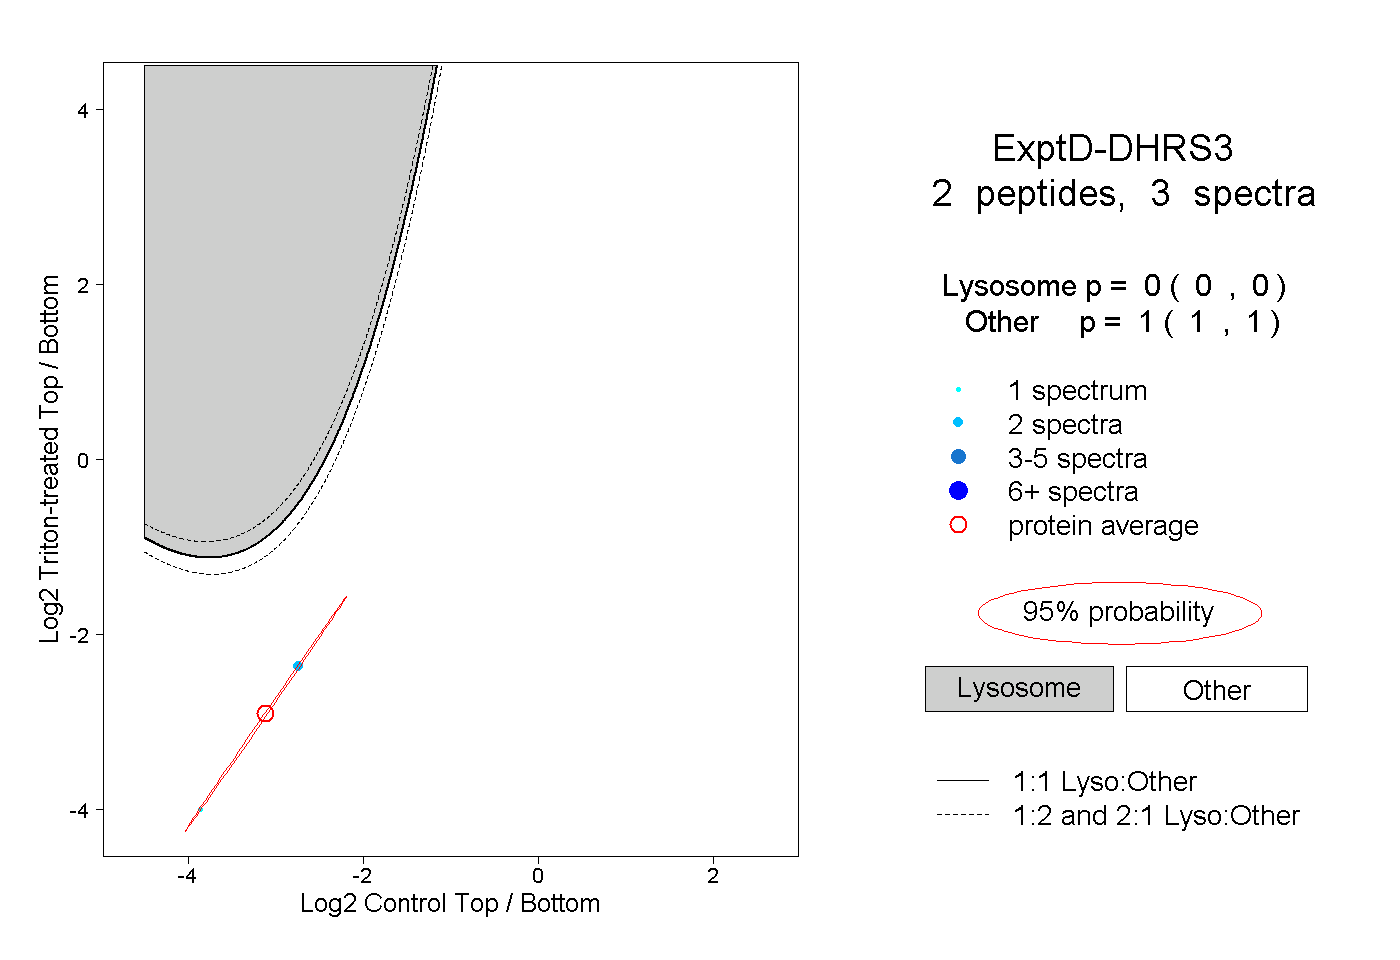 |
0.000 0.000 | 0.000 |
1.000 1.000 | 1.000 |