 8
8peptides
spectra
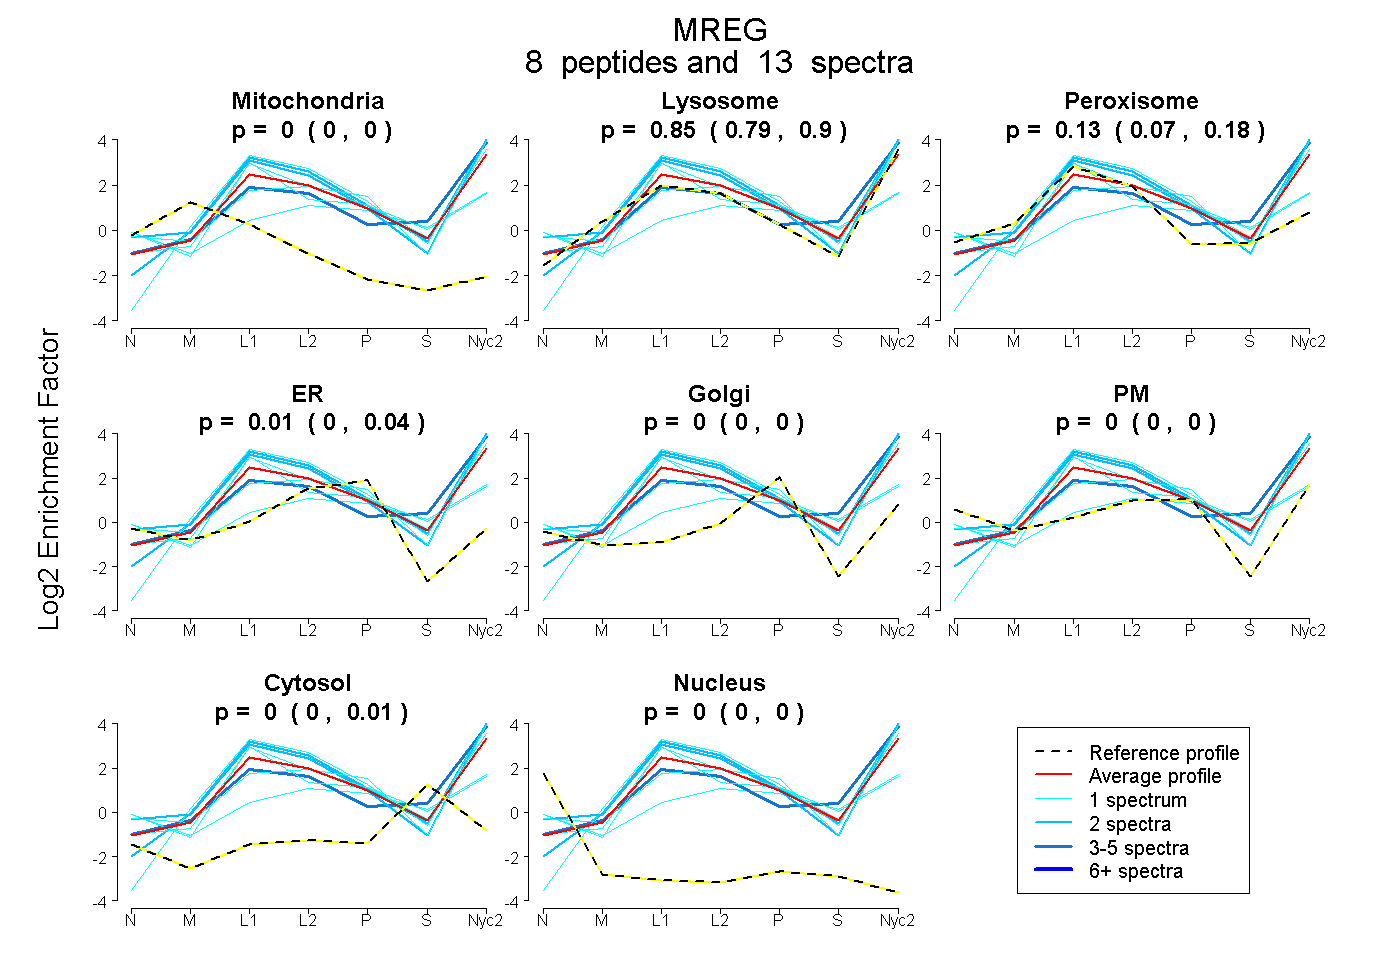
0.000 | 0.000
0.792 | 0.902
0.074 | 0.179
0.000 | 0.039
0.000 | 0.000
0.000 | 0.000
0.000 | 0.009
0.000 | 0.000
4peptides
spectra
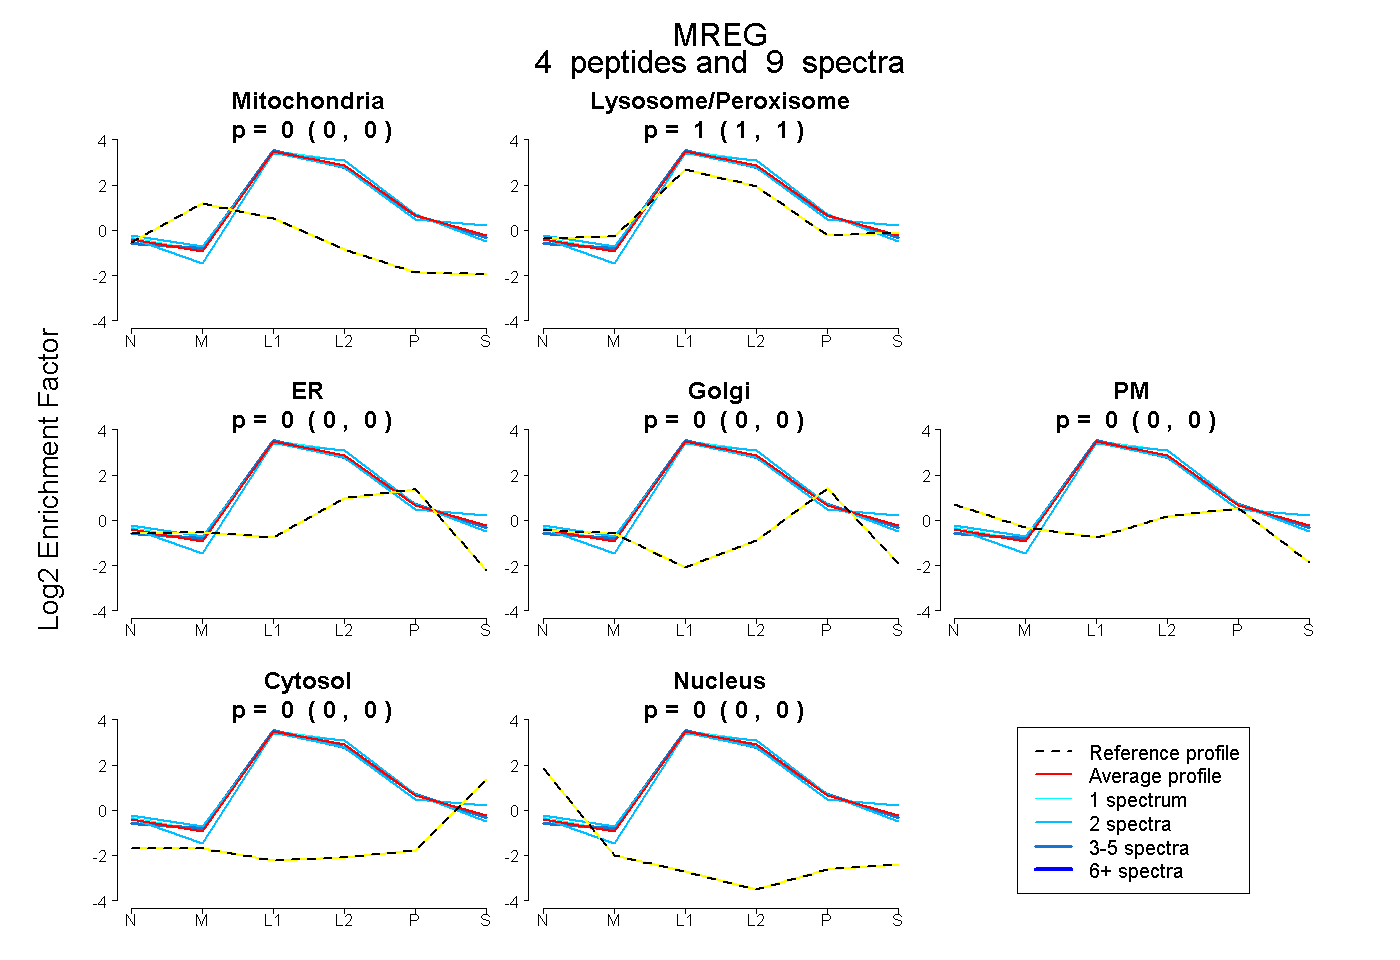
0.000 | 0.000
1.000 | 1.000
0.000 | 0.000
0.000 | 0.000
0.000 | 0.000
0.000 | 0.000
0.000 | 0.000
12peptides
spectra
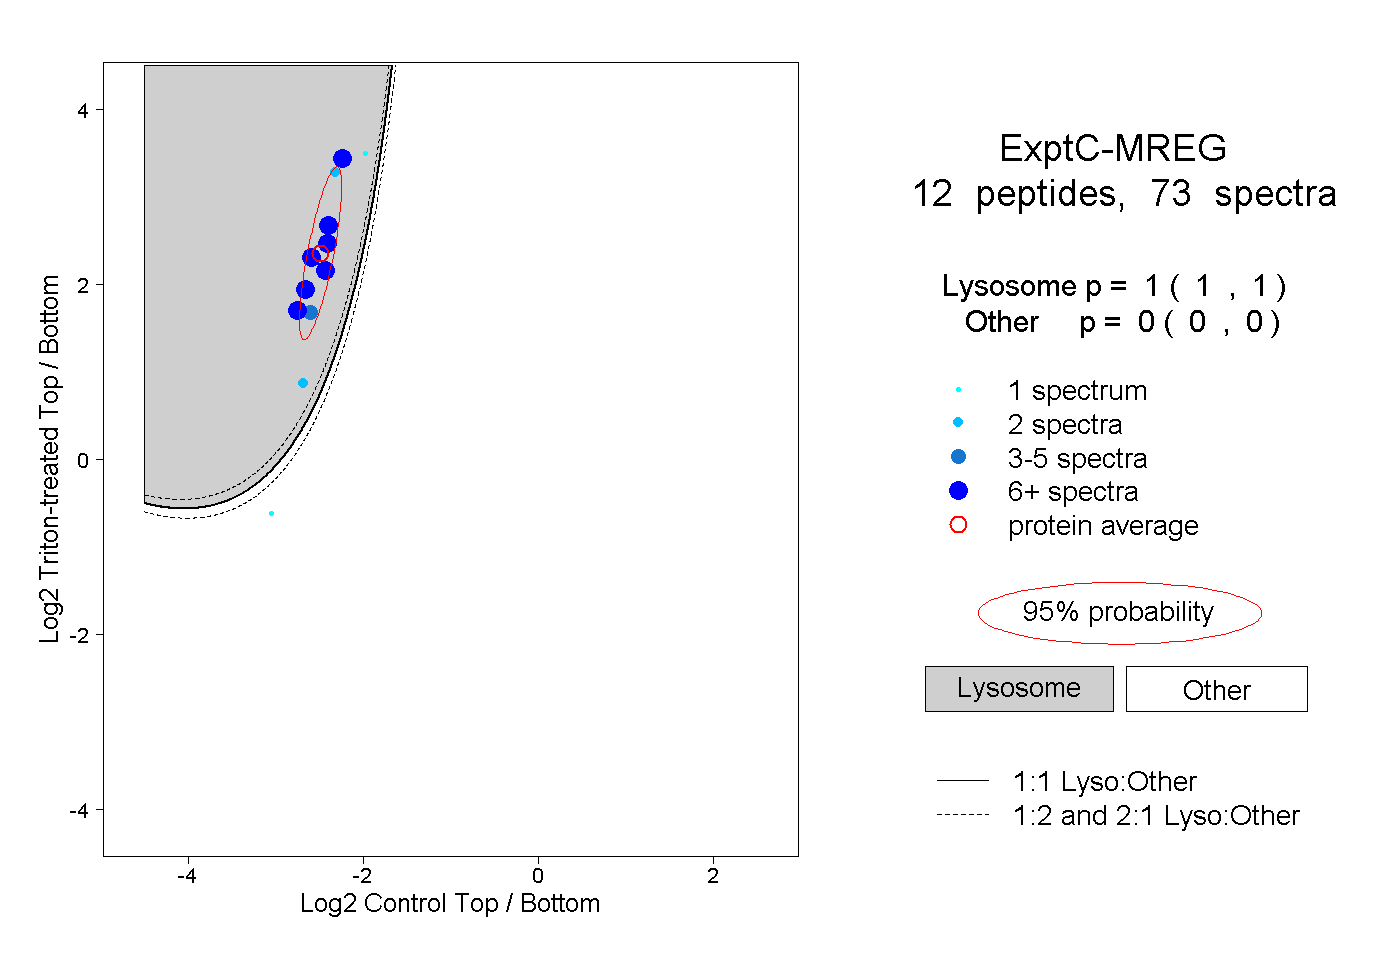
1.000 | 1.000
0.000 | 0.000
3peptides
spectra
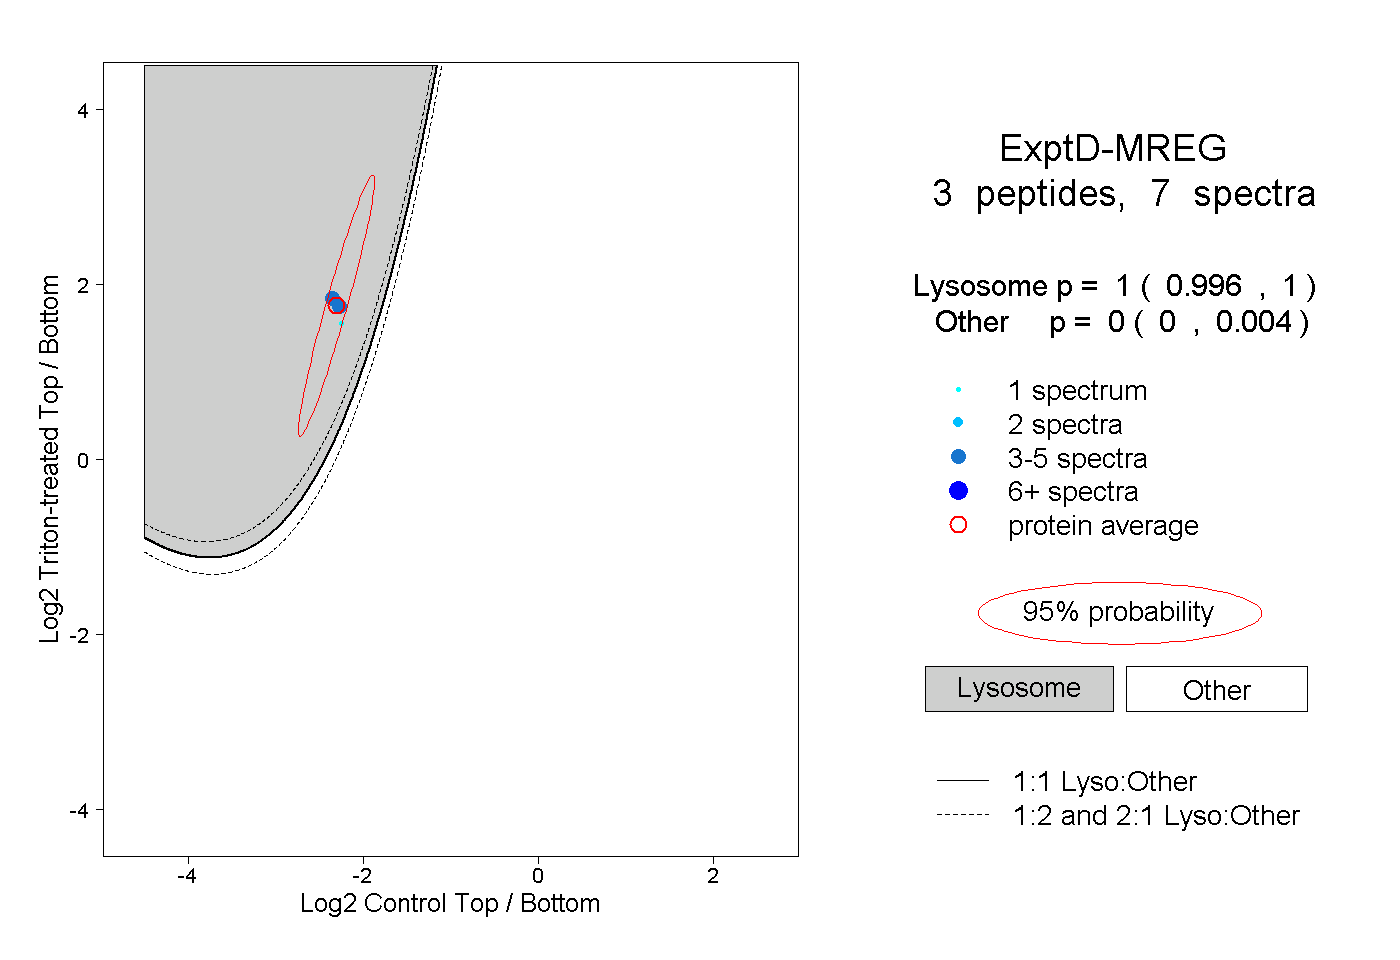
0.996 | 1.000
0.000 | 0.004