 8
8peptides
spectra
0.000 | 0.000
0.792 | 0.902
0.074 | 0.179
0.000 | 0.039
0.000 | 0.000
0.000 | 0.000
0.000 | 0.009
0.000 | 0.000
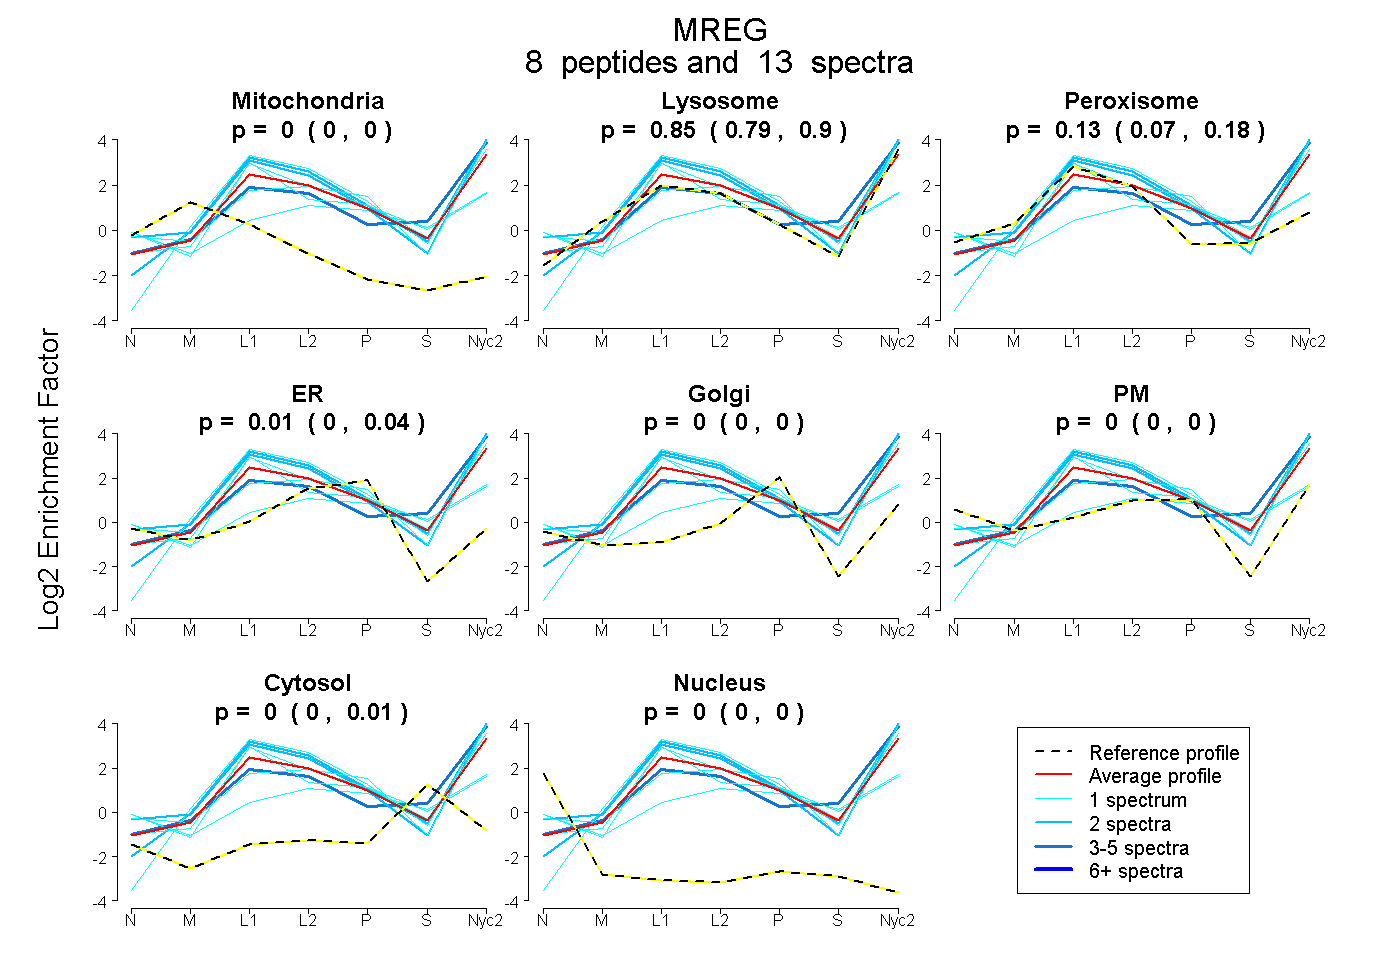
| Plot | Mito | Lyso | Perox | ER | Golgi | PM | Cytosol | Nucleus | |||||
| Expt A |
8 peptides |
13 spectra |
|
0.000 0.000 | 0.000 |
0.853 0.792 | 0.902 |
0.133 0.074 | 0.179 |
0.014 0.000 | 0.039 |
0.000 0.000 | 0.000 |
0.000 0.000 | 0.000 |
0.000 0.000 | 0.009 |
0.000 0.000 | 0.000 |
| 1 spectrum, KPGVPCLVDGQR | 0.000 | 0.738 | 0.152 | 0.000 | 0.000 | 0.111 | 0.000 | 0.000 | ||
| 1 spectrum, SACCCCPCR | 0.000 | 0.333 | 0.569 | 0.086 | 0.000 | 0.000 | 0.012 | 0.000 | ||
| 1 spectrum, YLLIVDR | 0.000 | 0.741 | 0.000 | 0.000 | 0.000 | 0.259 | 0.000 | 0.000 | ||
| 4 spectra, ILEDLGFQR | 0.000 | 0.912 | 0.000 | 0.000 | 0.000 | 0.000 | 0.088 | 0.000 | ||
| 2 spectra, LNYDIYTLR | 0.000 | 0.938 | 0.062 | 0.000 | 0.000 | 0.000 | 0.000 | 0.000 | ||
| 2 spectra, DSEEWQR | 0.000 | 1.000 | 0.000 | 0.000 | 0.000 | 0.000 | 0.000 | 0.000 | ||
| 1 spectrum, ILYNLIVVR | 0.000 | 1.000 | 0.000 | 0.000 | 0.000 | 0.000 | 0.000 | 0.000 | ||
| 1 spectrum, IASQMYPK | 0.000 | 0.286 | 0.078 | 0.000 | 0.000 | 0.367 | 0.270 | 0.000 |
| Plot | Mito | Lyso or Perox | ER | Golgi | PM | Cytosol | Nucleus | ||||||
| Expt B |
4 peptides |
9 spectra |
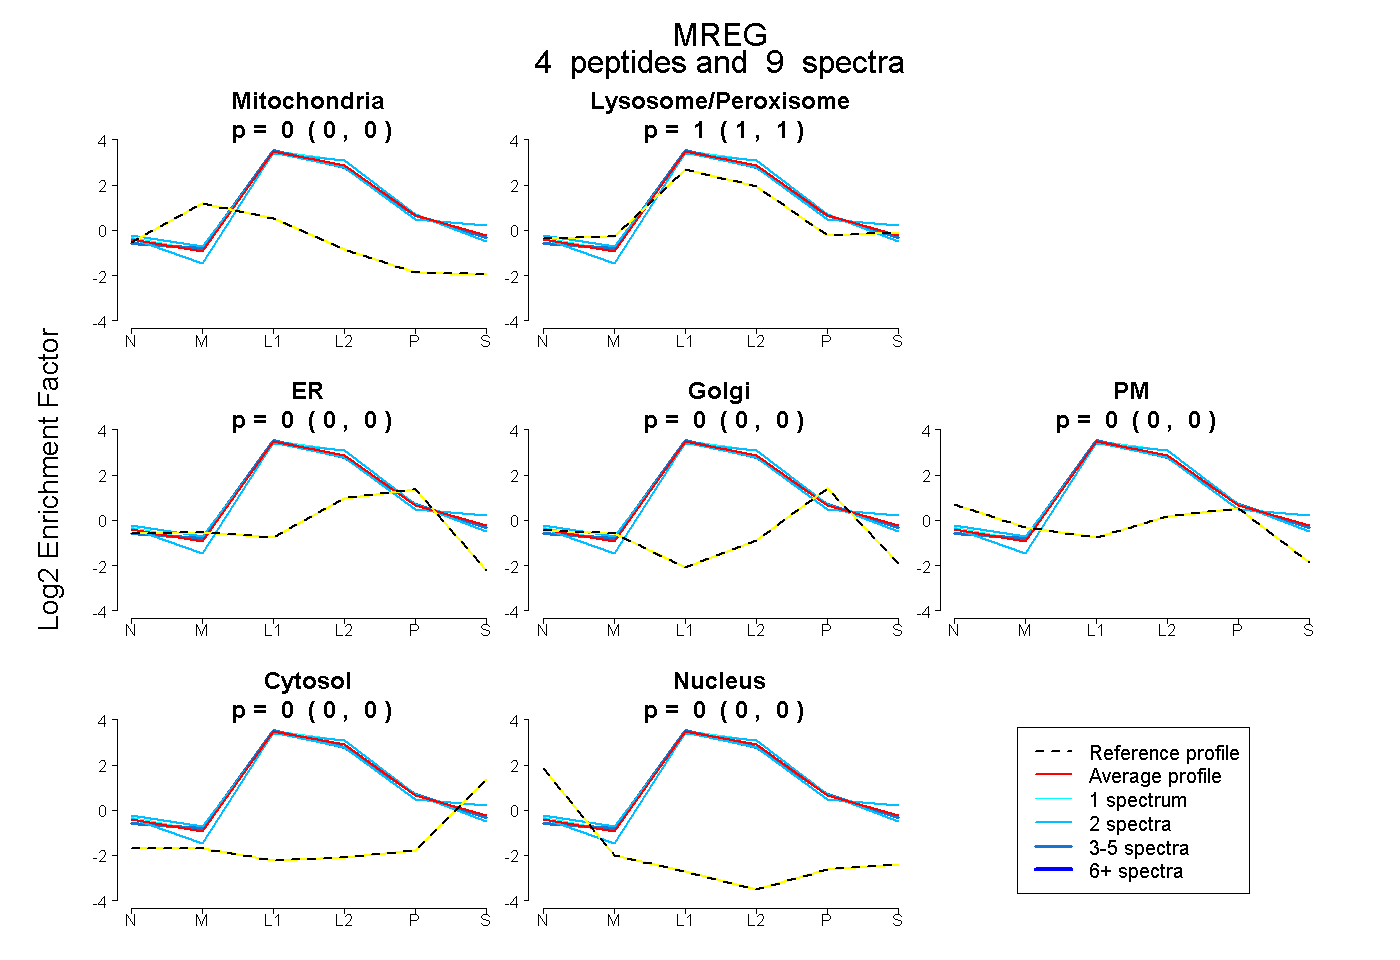 |
0.000 0.000 | 0.000 |
1.000 1.000 | 1.000 |
0.000 0.000 | 0.000 |
0.000 0.000 | 0.000 |
0.000 0.000 | 0.000 |
0.000 0.000 | 0.000 |
0.000 0.000 | 0.000 |
|||
| Plot | Lyso | Other | |||||||||||
| Expt C |
12 peptides |
73 spectra |
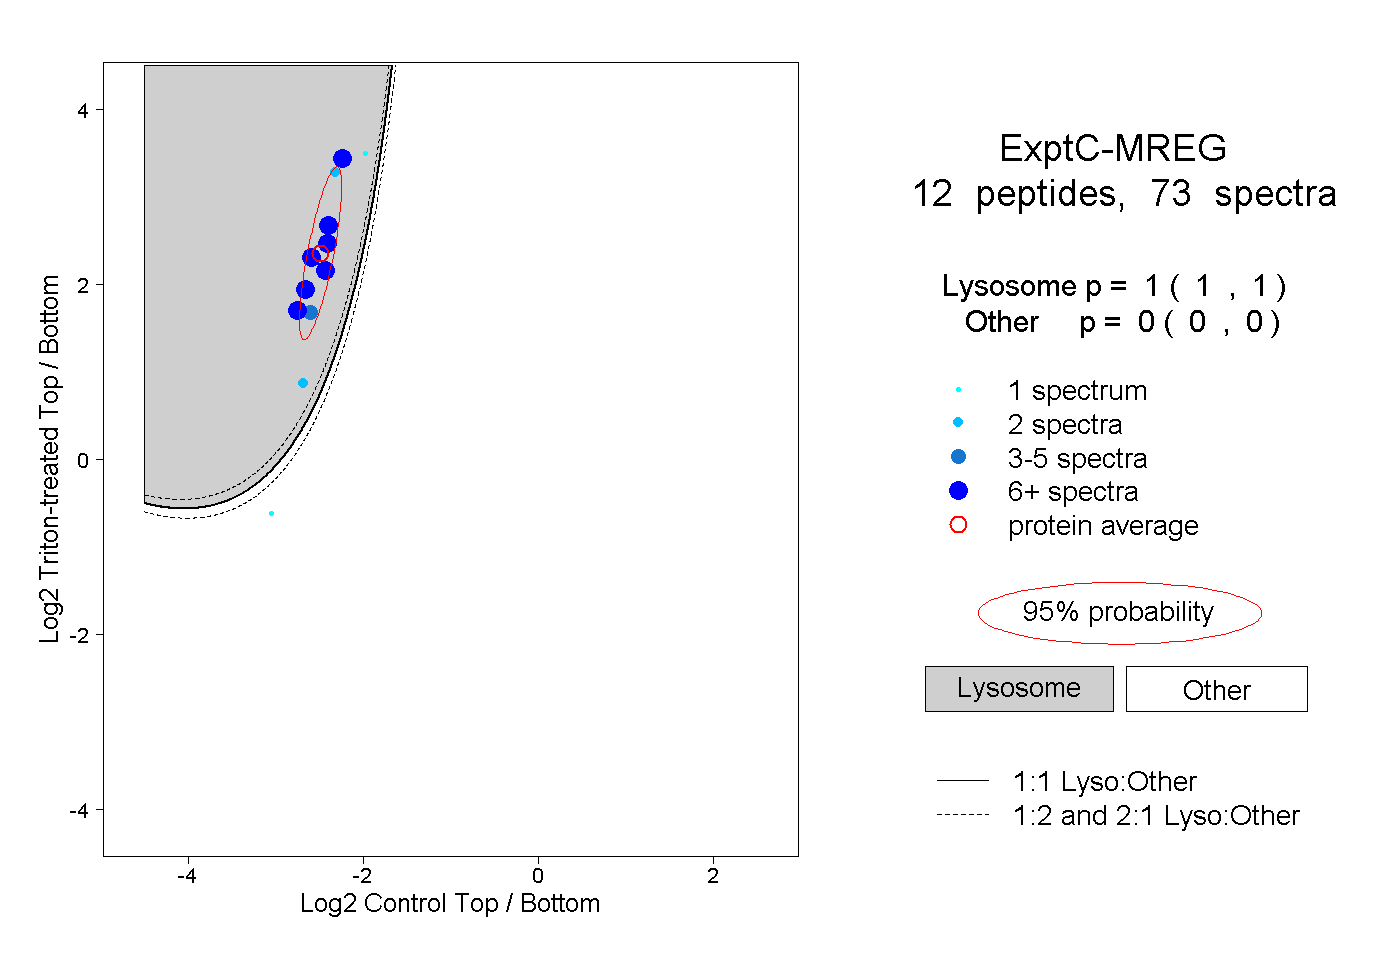 |
1.000 1.000 | 1.000 |
0.000 0.000 | 0.000 |
||||||||
| Plot | Lyso | Other | |||||||||||
| Expt D |
3 peptides |
7 spectra |
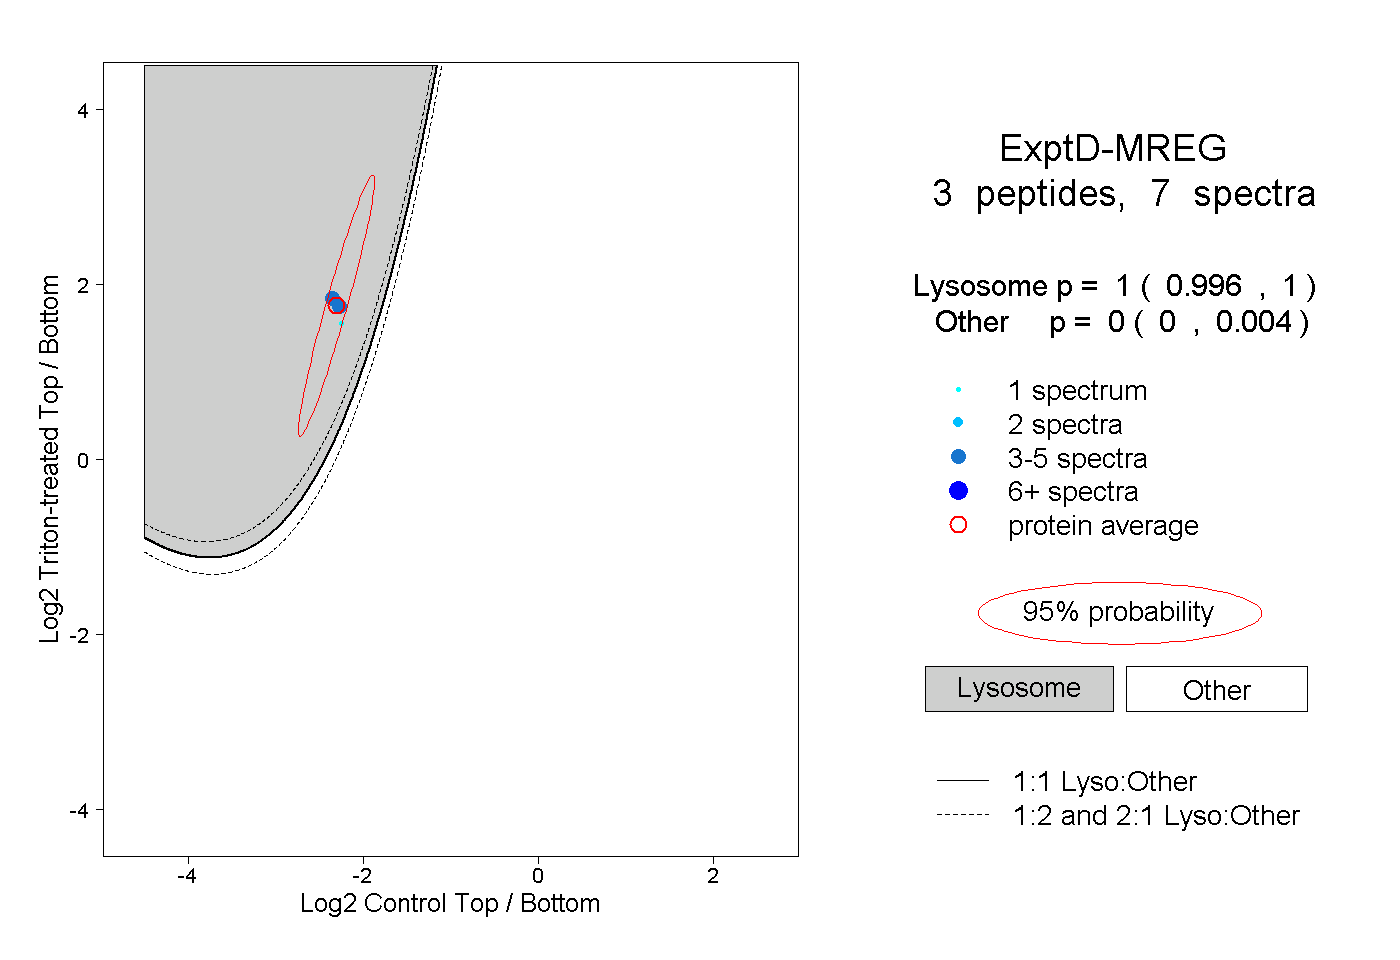 |
1.000 0.996 | 1.000 |
0.000 0.000 | 0.004 |