 7
7peptides
spectra
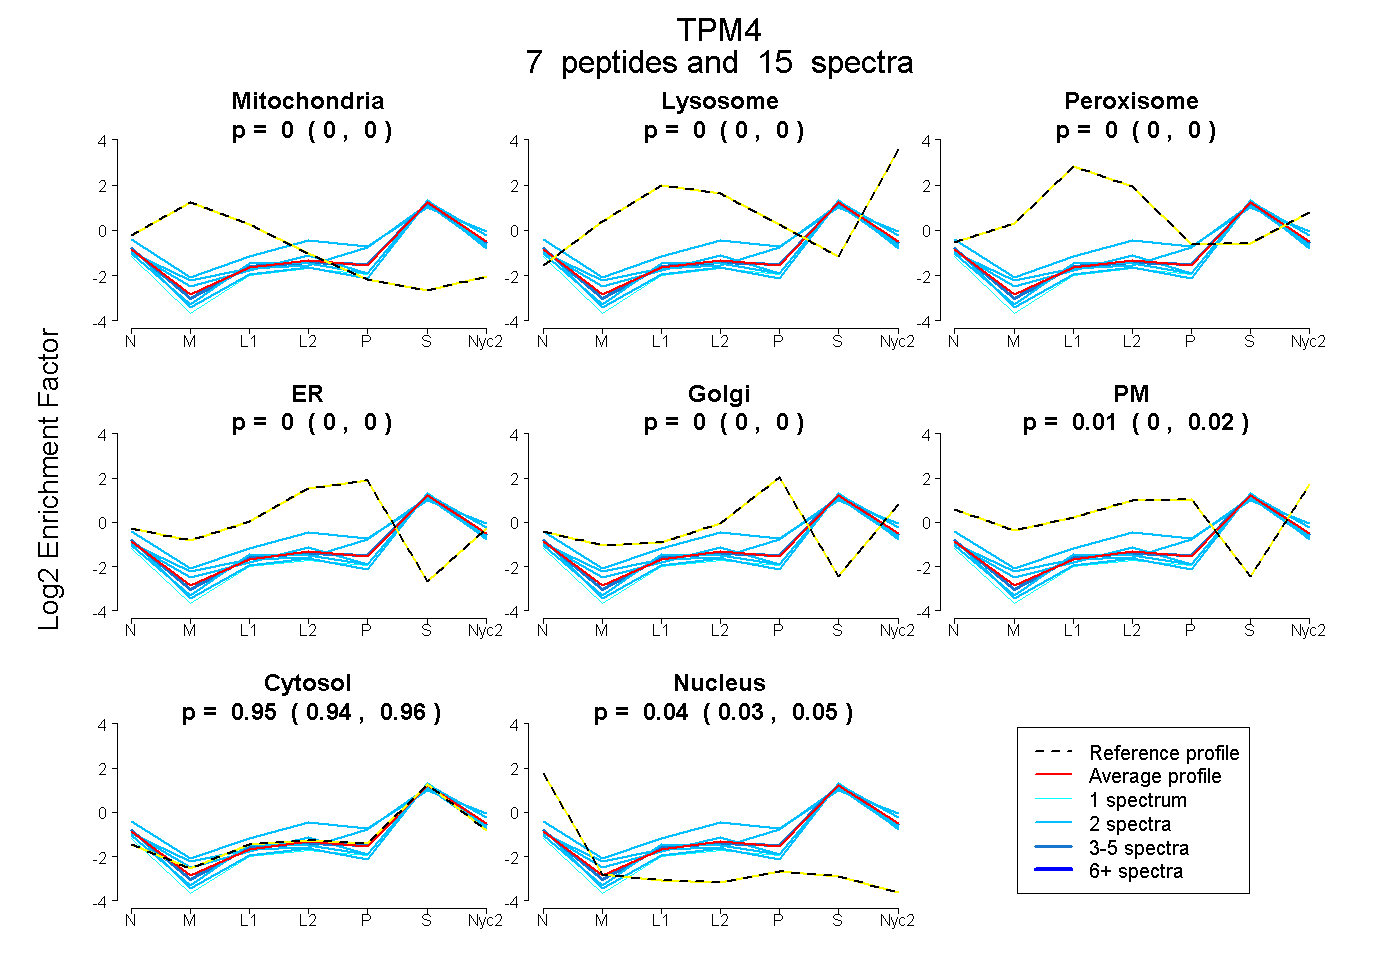
0.000 | 0.000
0.000 | 0.000
0.000 | 0.000
0.000 | 0.000
0.000 | 0.000
0.000 | 0.018
0.943 | 0.958
0.032 | 0.046
3peptides
spectra
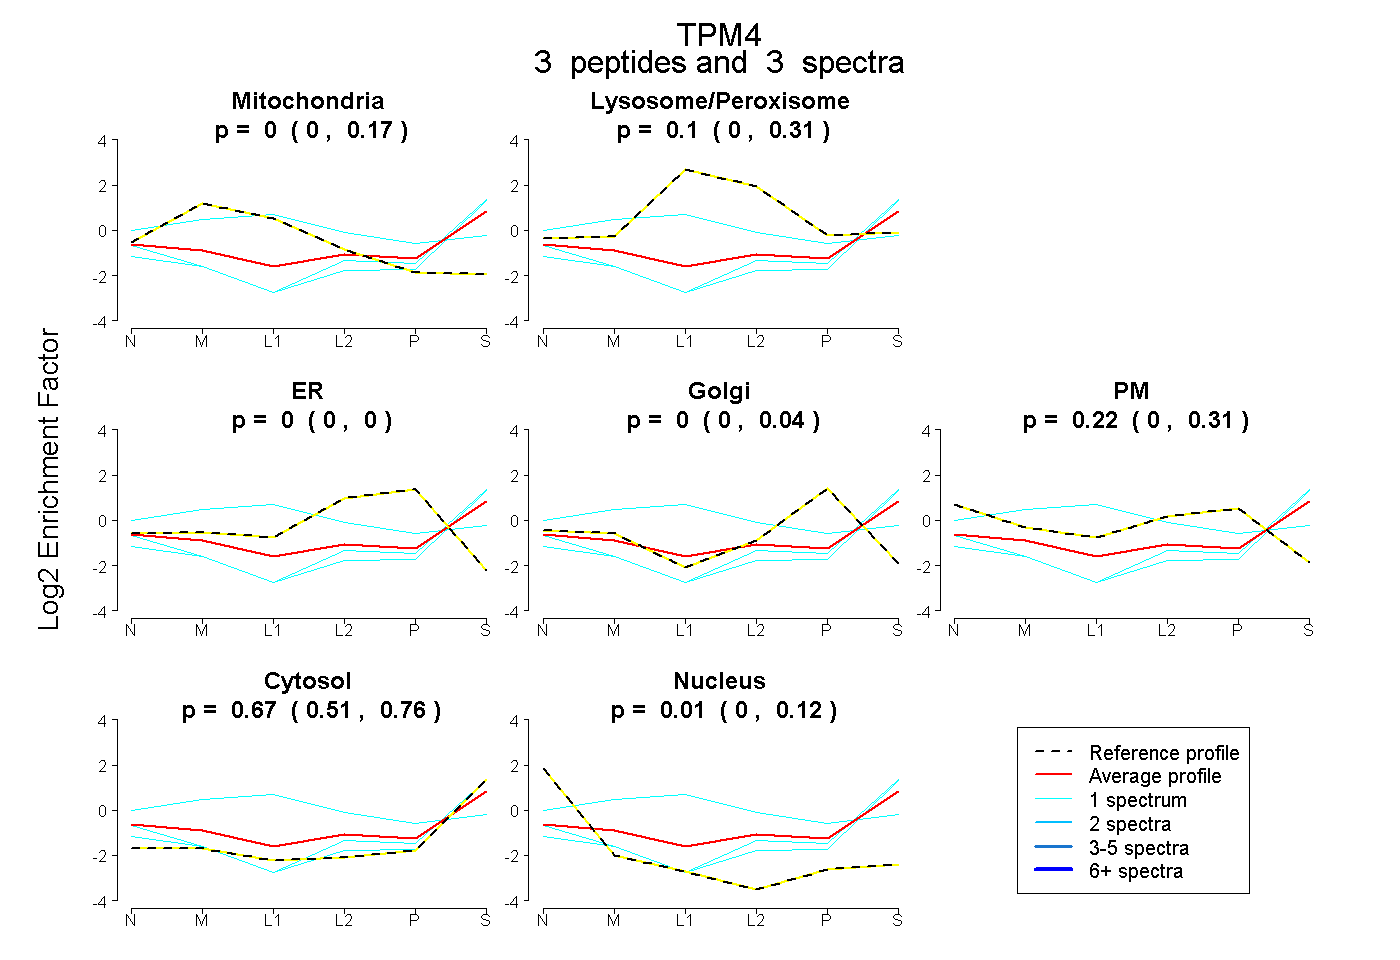
0.000 | 0.168
0.000 | 0.310
0.000 | 0.000
0.000 | 0.039
0.000 | 0.314
0.506 | 0.759
0.000 | 0.120
8peptides
spectra
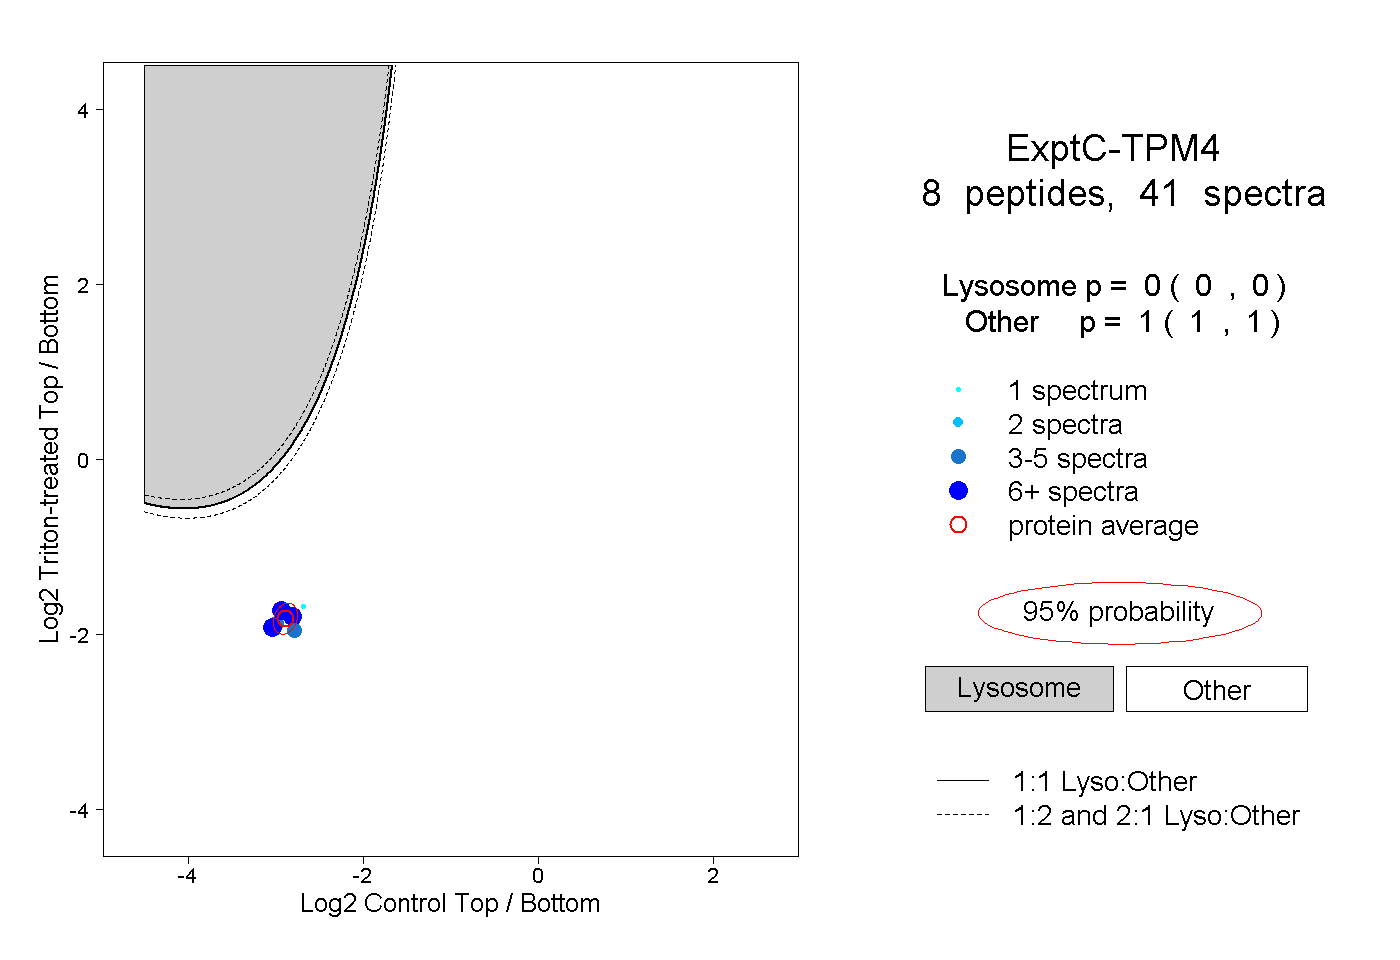
0.000 | 0.000
1.000 | 1.000
4peptides
spectra
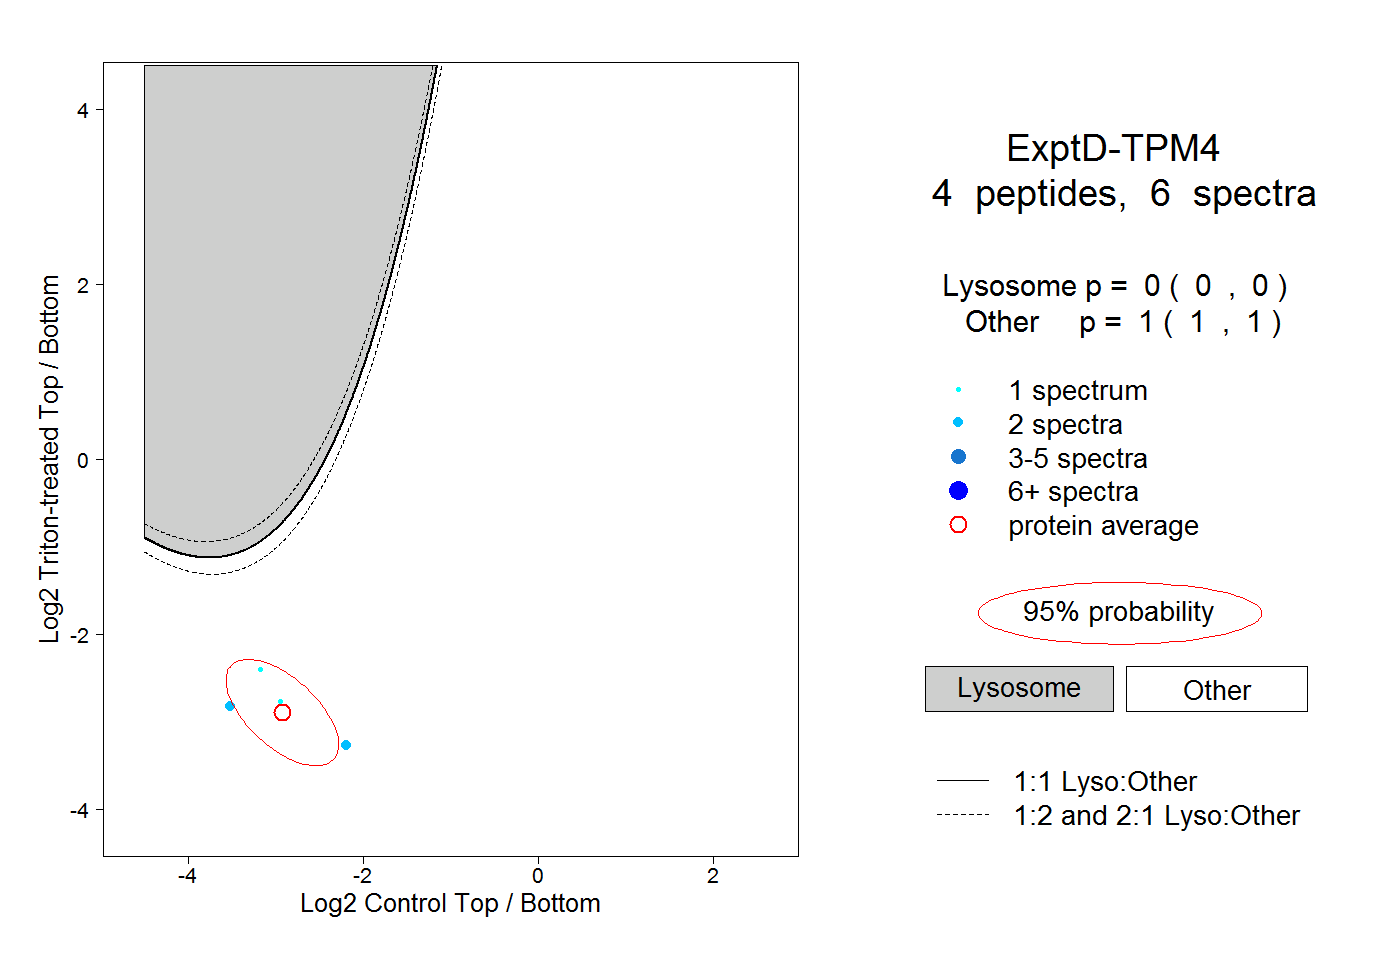
0.000 | 0.000
1.000 | 1.000