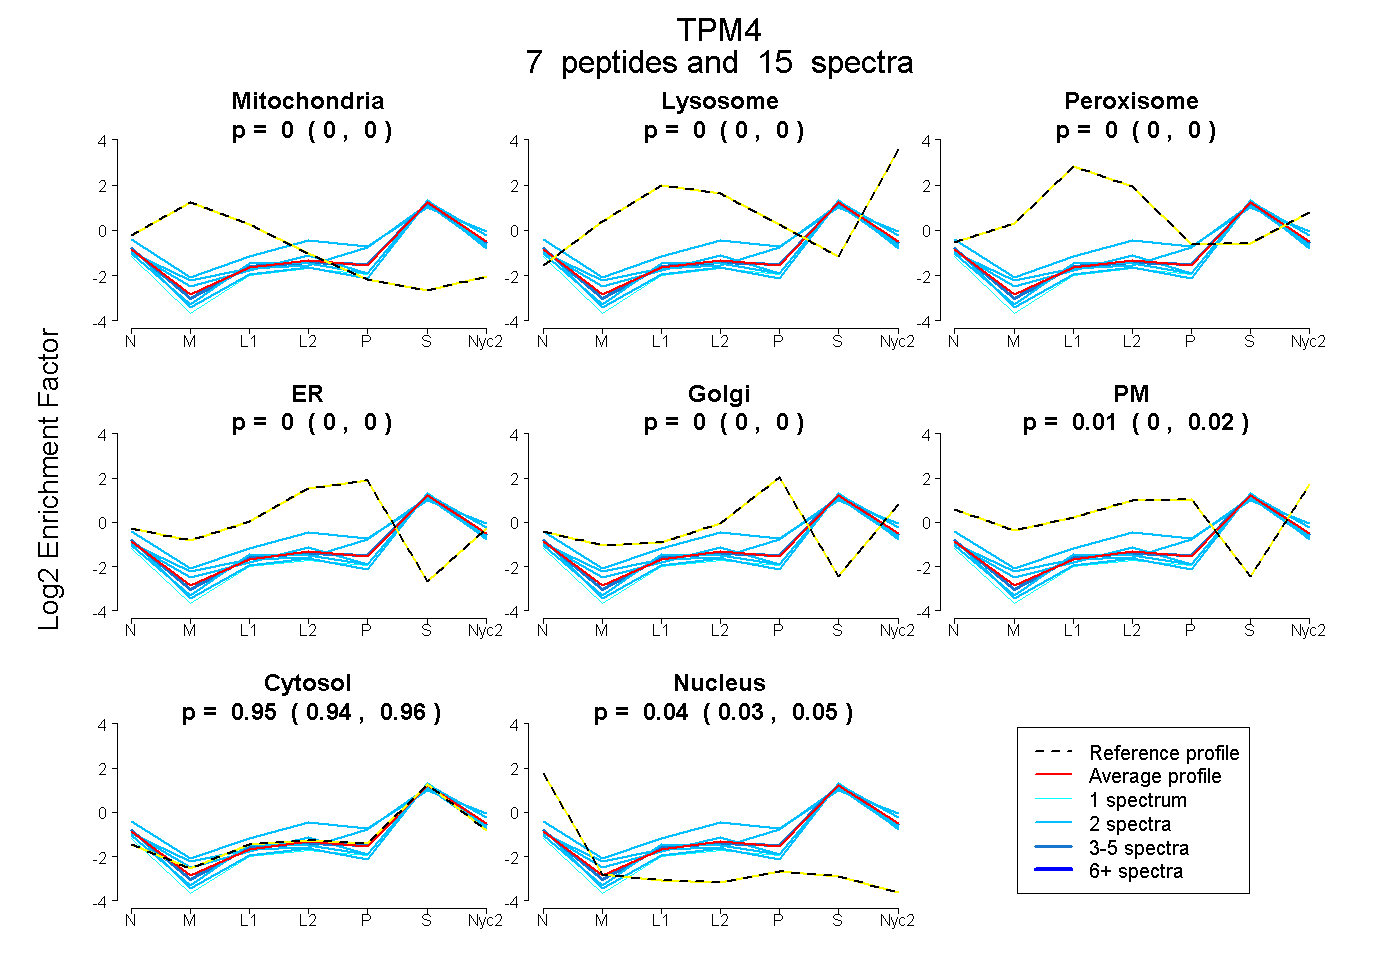
 7
7peptides
spectra
0.000 | 0.000
0.000 | 0.000
0.000 | 0.000
0.000 | 0.000
0.000 | 0.000
0.000 | 0.018
0.943 | 0.958
0.032 | 0.046
| Plot | Mito | Lyso | Perox | ER | Golgi | PM | Cytosol | Nucleus | |||||
| Expt A |
7 peptides |
15 spectra |
|
0.000 0.000 | 0.000 |
0.000 0.000 | 0.000 |
0.000 0.000 | 0.000 |
0.000 0.000 | 0.000 |
0.000 0.000 | 0.000 |
0.009 0.000 | 0.018 |
0.951 0.943 | 0.958 |
0.040 0.032 | 0.046 |
| 4 spectra, SLEAASEK | 0.000 | 0.000 | 0.000 | 0.000 | 0.000 | 0.000 | 0.954 | 0.046 | ||
| 2 spectra, MELQEMQLK | 0.000 | 0.000 | 0.000 | 0.000 | 0.091 | 0.000 | 0.881 | 0.028 | ||
| 2 spectra, ELDGER | 0.000 | 0.000 | 0.011 | 0.000 | 0.000 | 0.225 | 0.764 | 0.000 | ||
| 1 spectrum, AQGLQR | 0.000 | 0.000 | 0.000 | 0.000 | 0.000 | 0.000 | 0.950 | 0.050 | ||
| 2 spectra, IQALQQQADDAEDR | 0.000 | 0.027 | 0.000 | 0.000 | 0.000 | 0.000 | 0.944 | 0.029 | ||
| 2 spectra, LVILEGELER | 0.000 | 0.000 | 0.000 | 0.000 | 0.000 | 0.000 | 0.894 | 0.106 | ||
| 2 spectra, TIDDLEEK | 0.000 | 0.000 | 0.000 | 0.000 | 0.000 | 0.000 | 0.959 | 0.041 |
| Plot | Mito | Lyso or Perox | ER | Golgi | PM | Cytosol | Nucleus | ||||||
| Expt B |
3 peptides |
3 spectra |
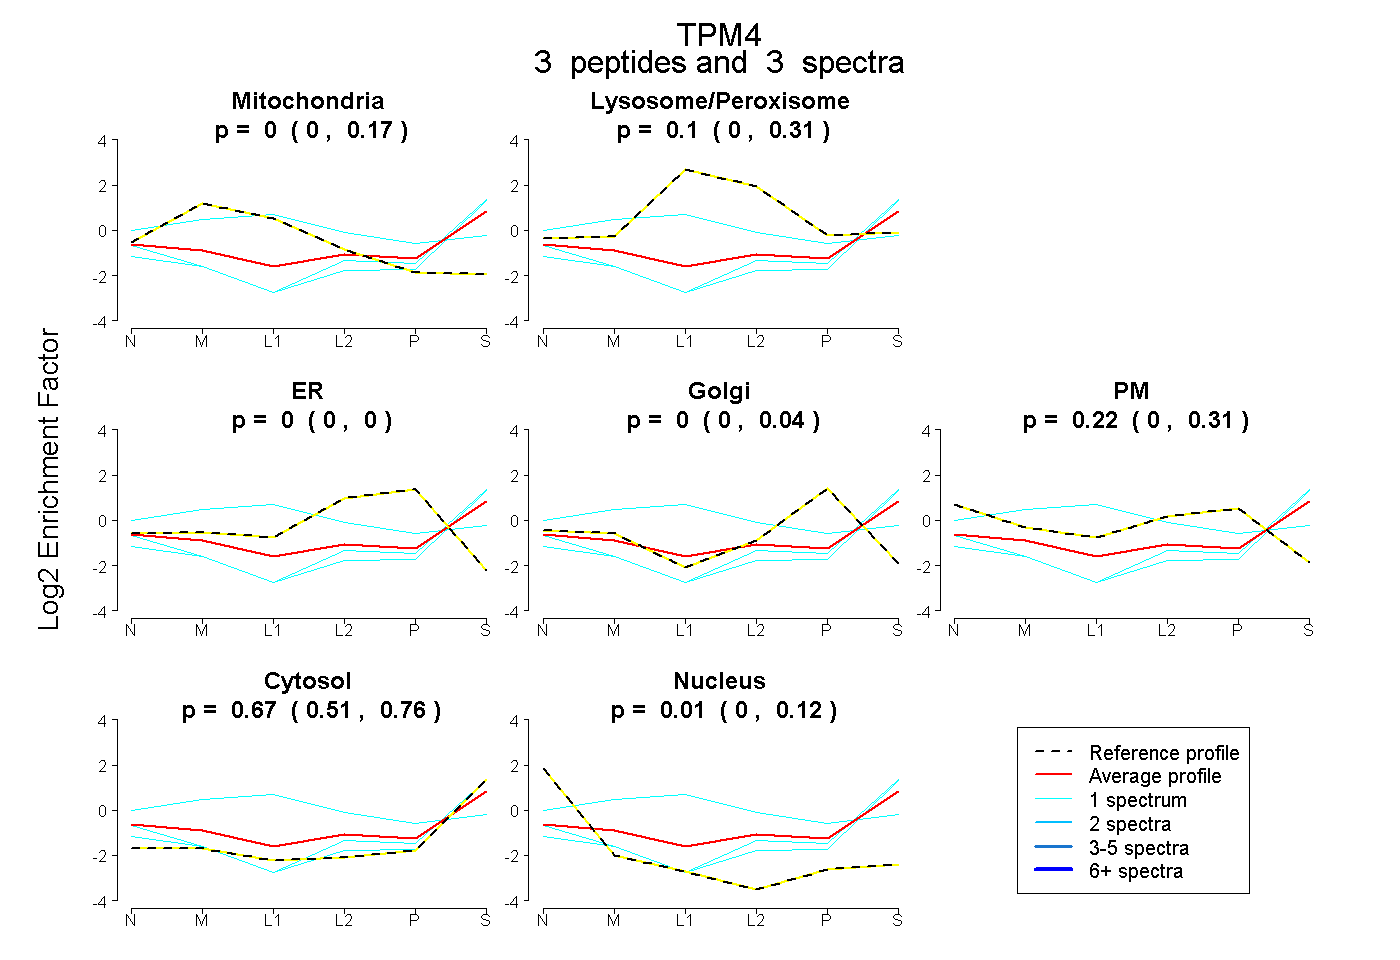 |
0.000 0.000 | 0.168 |
0.096 0.000 | 0.310 |
0.000 0.000 | 0.000 |
0.000 0.000 | 0.039 |
0.222 0.000 | 0.314 |
0.674 0.506 | 0.759 |
0.008 0.000 | 0.120 |
|||
| Plot | Lyso | Other | |||||||||||
| Expt C |
8 peptides |
41 spectra |
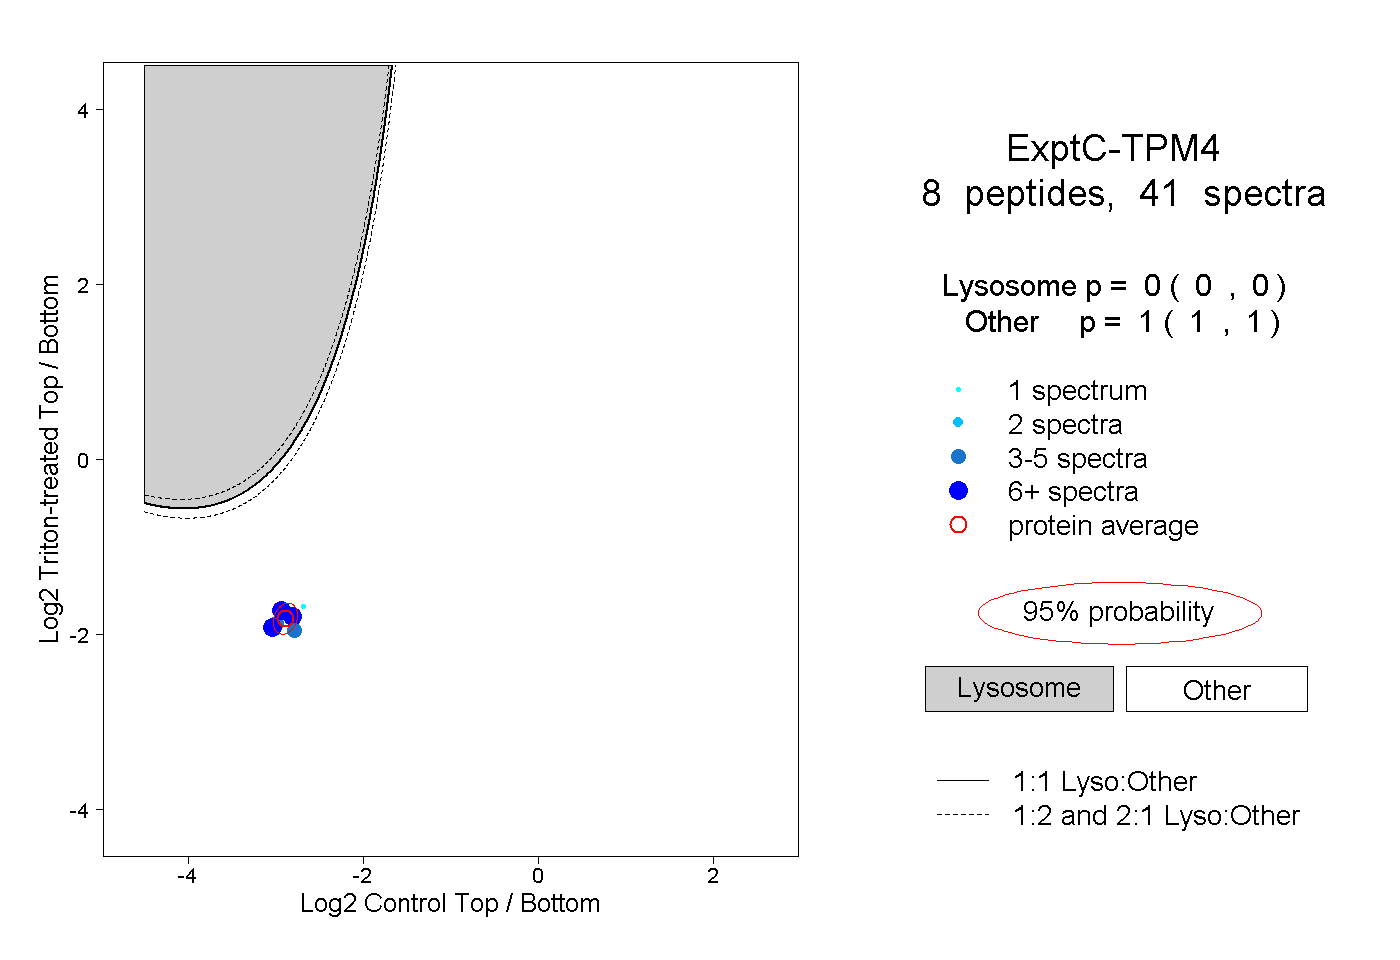 |
0.000 0.000 | 0.000 |
1.000 1.000 | 1.000 |
||||||||
| Plot | Lyso | Other | |||||||||||
| Expt D |
4 peptides |
6 spectra |
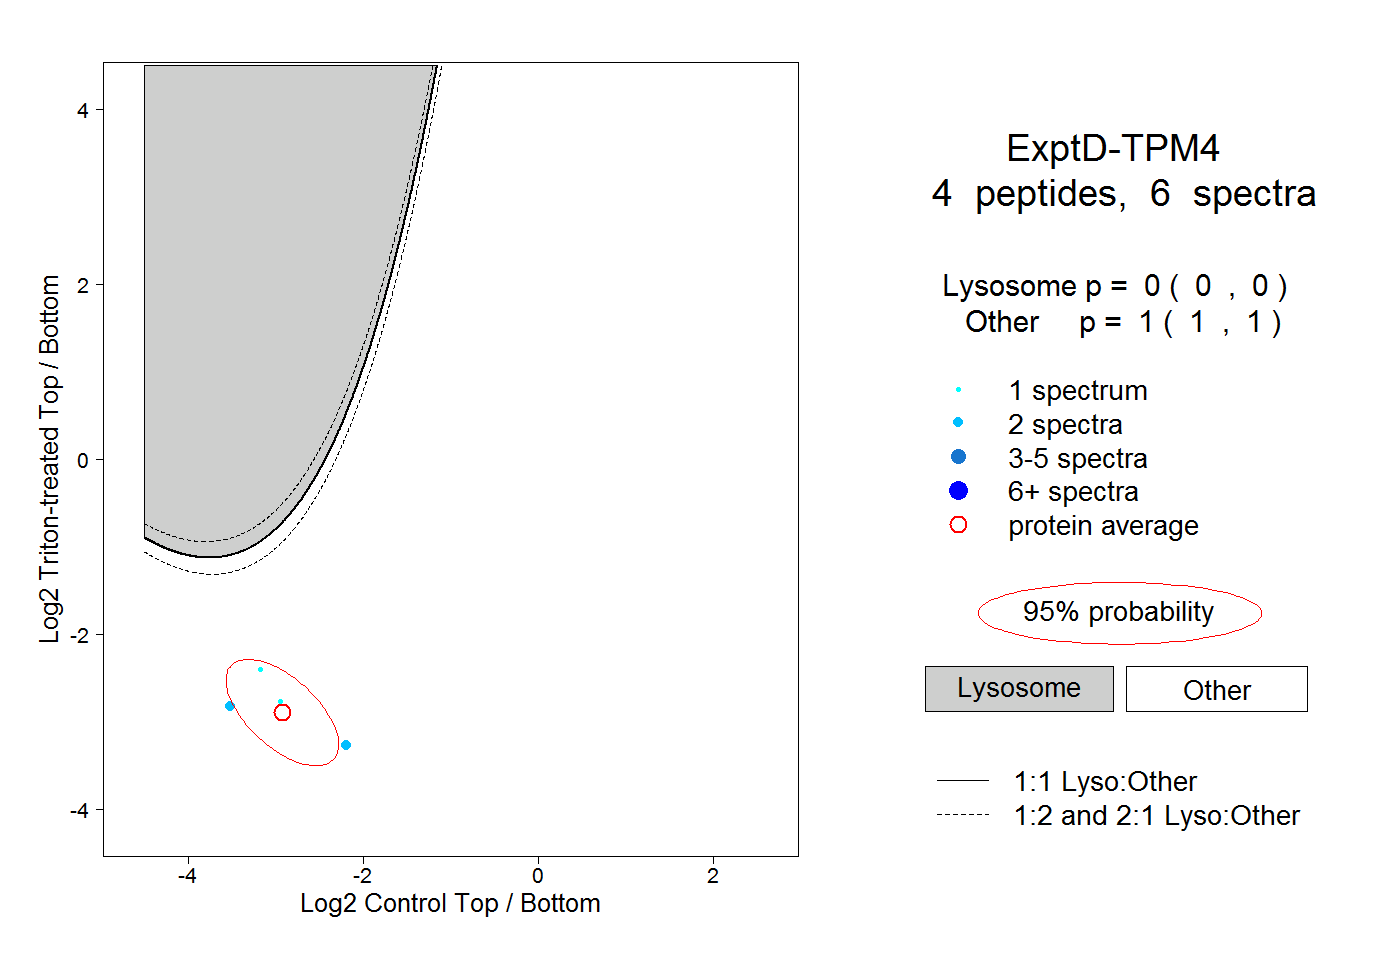 |
0.000 0.000 | 0.000 |
1.000 1.000 | 1.000 |