 6
6peptides
spectra
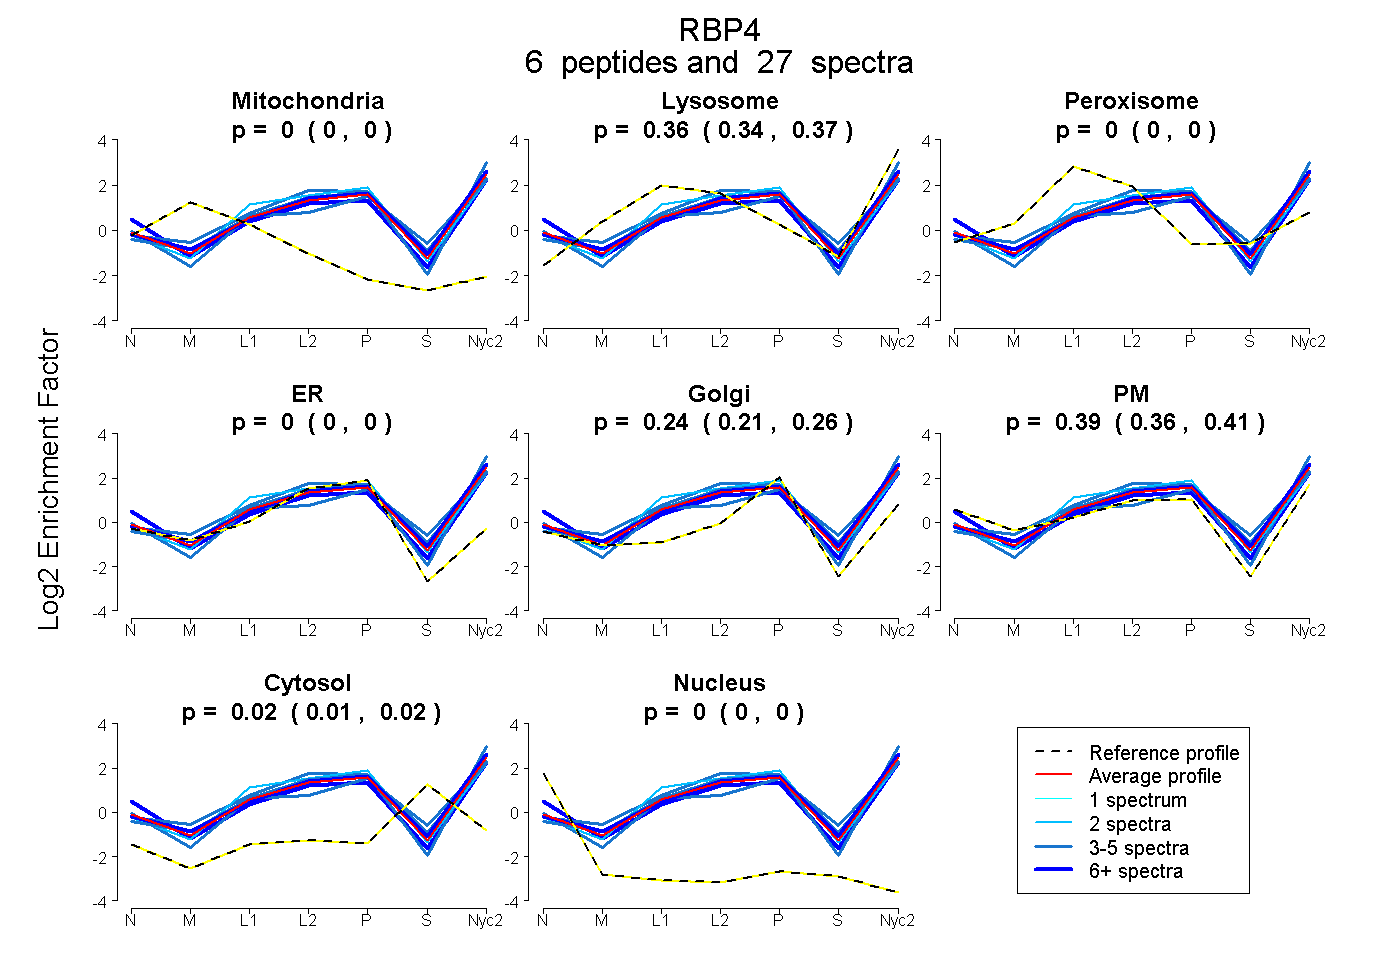
0.000 | 0.000
0.343 | 0.371
0.000 | 0.000
0.000 | 0.000
0.214 | 0.257
0.357 | 0.414
0.005 | 0.023
0.000 | 0.000
4peptides
spectra
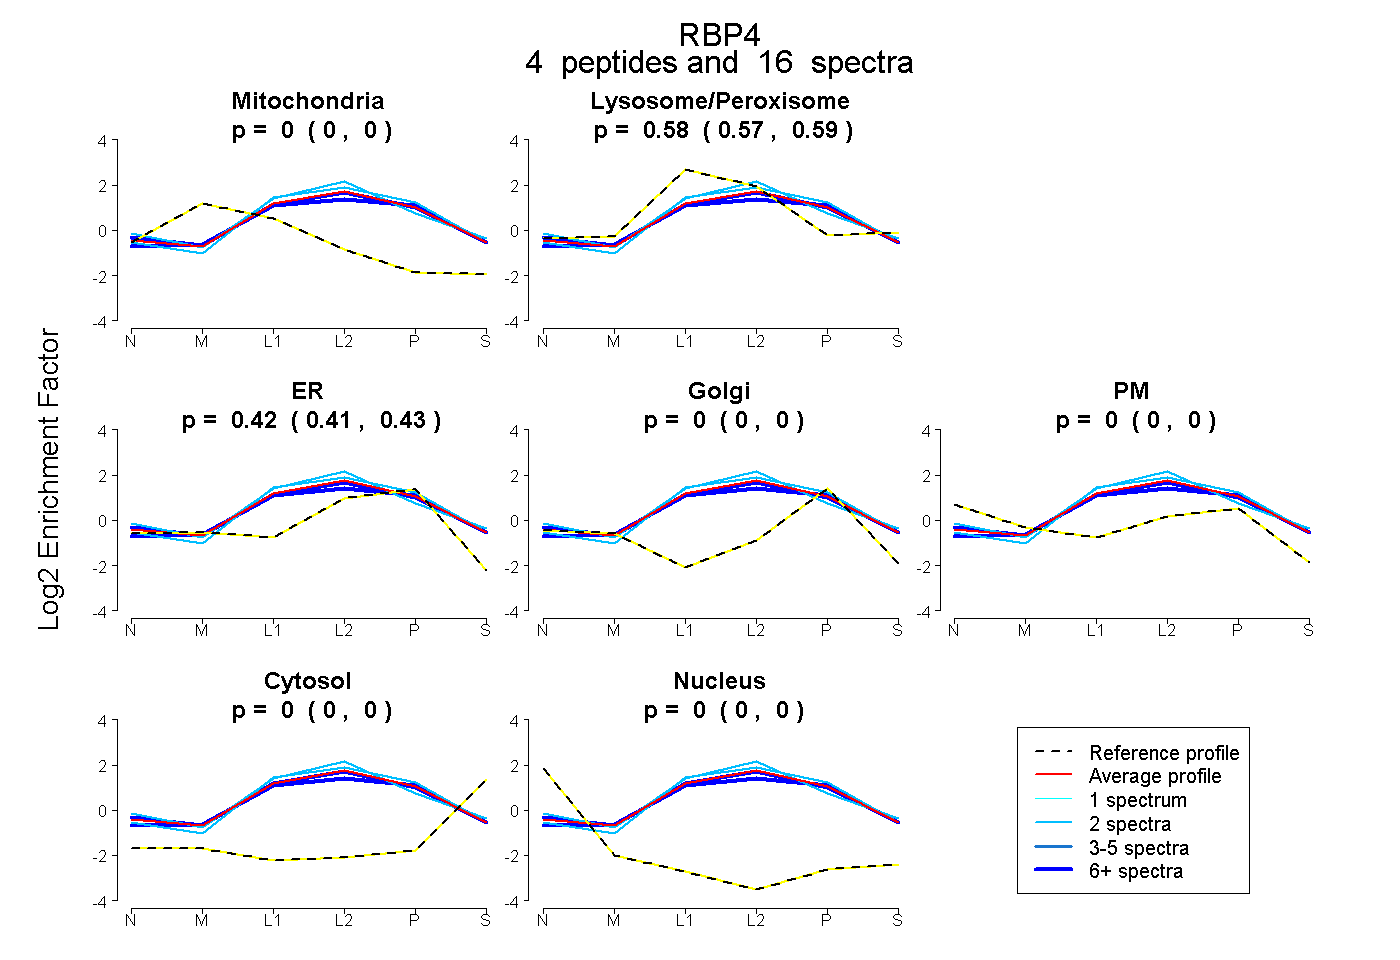
0.000 | 0.000
0.571 | 0.587
0.410 | 0.427
0.000 | 0.000
0.000 | 0.000
0.000 | 0.000
0.000 | 0.000
5peptides
spectra
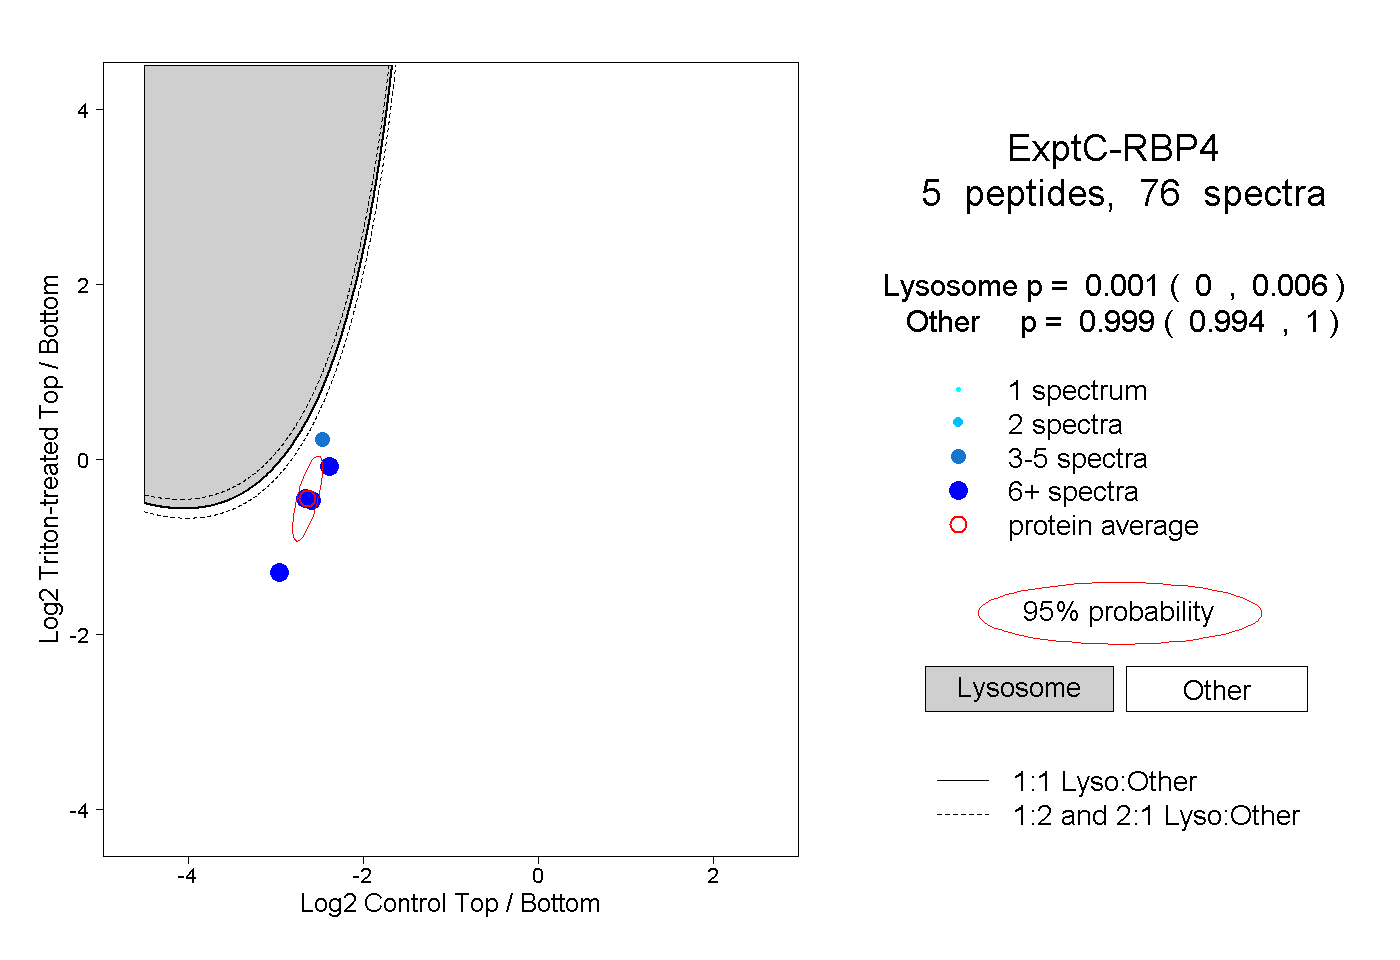
0.000 | 0.006
0.994 | 1.000
2peptides
spectra
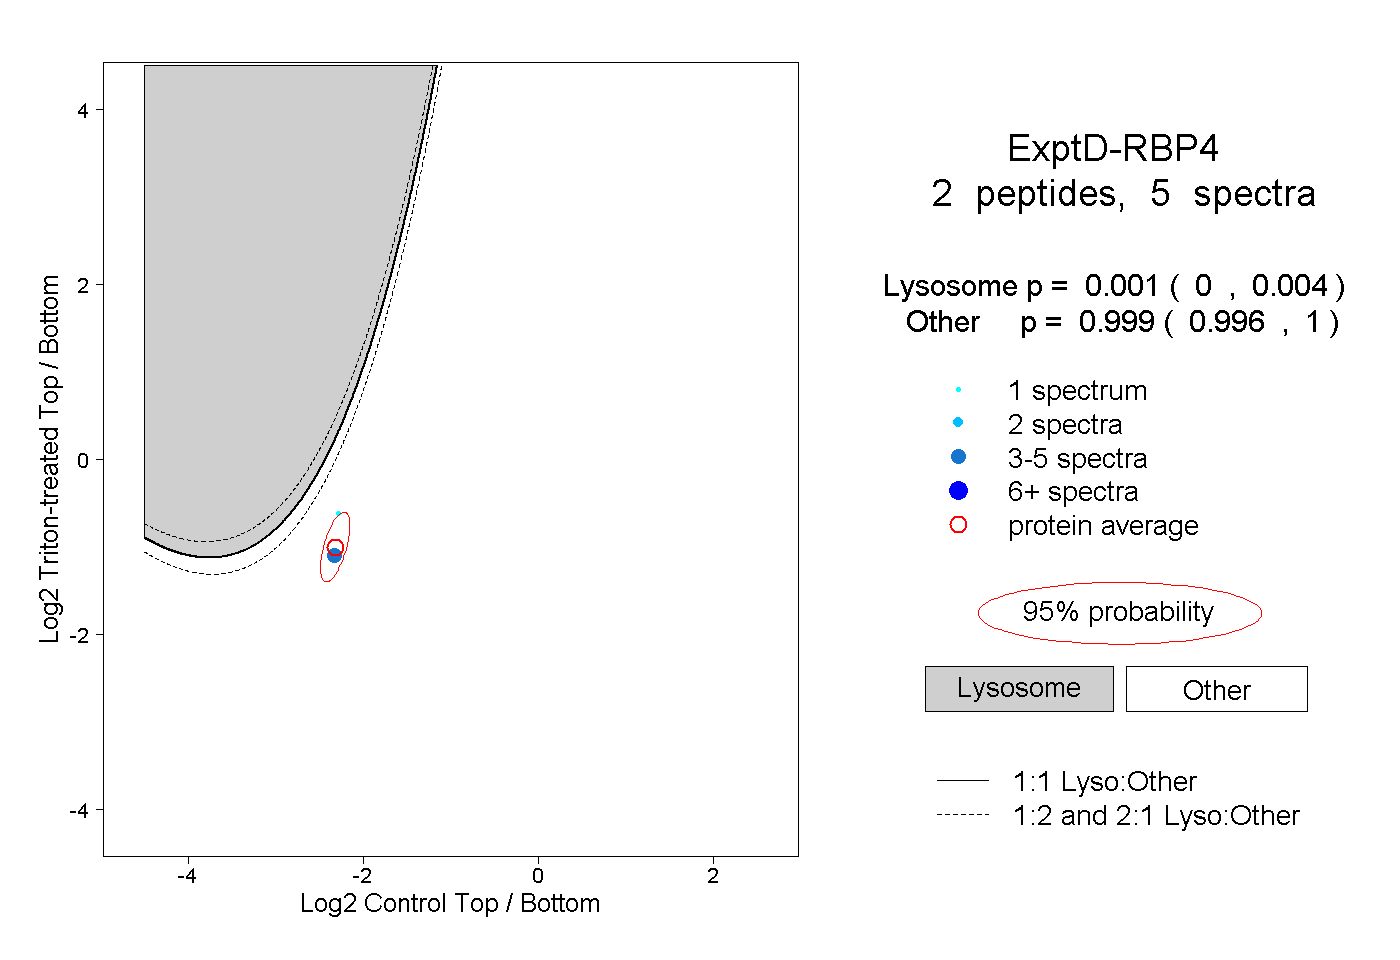
0.000 | 0.004
0.996 | 1.000