RBP4
[ENSRNOP00000021055]
Main page
| | | Plot |
Mito |
Lyso |
|
Perox |
ER |
Golgi |
PM |
Cytosol |
Nucleus |
|
| Expt A |
 6
6
peptides |
27
spectra |
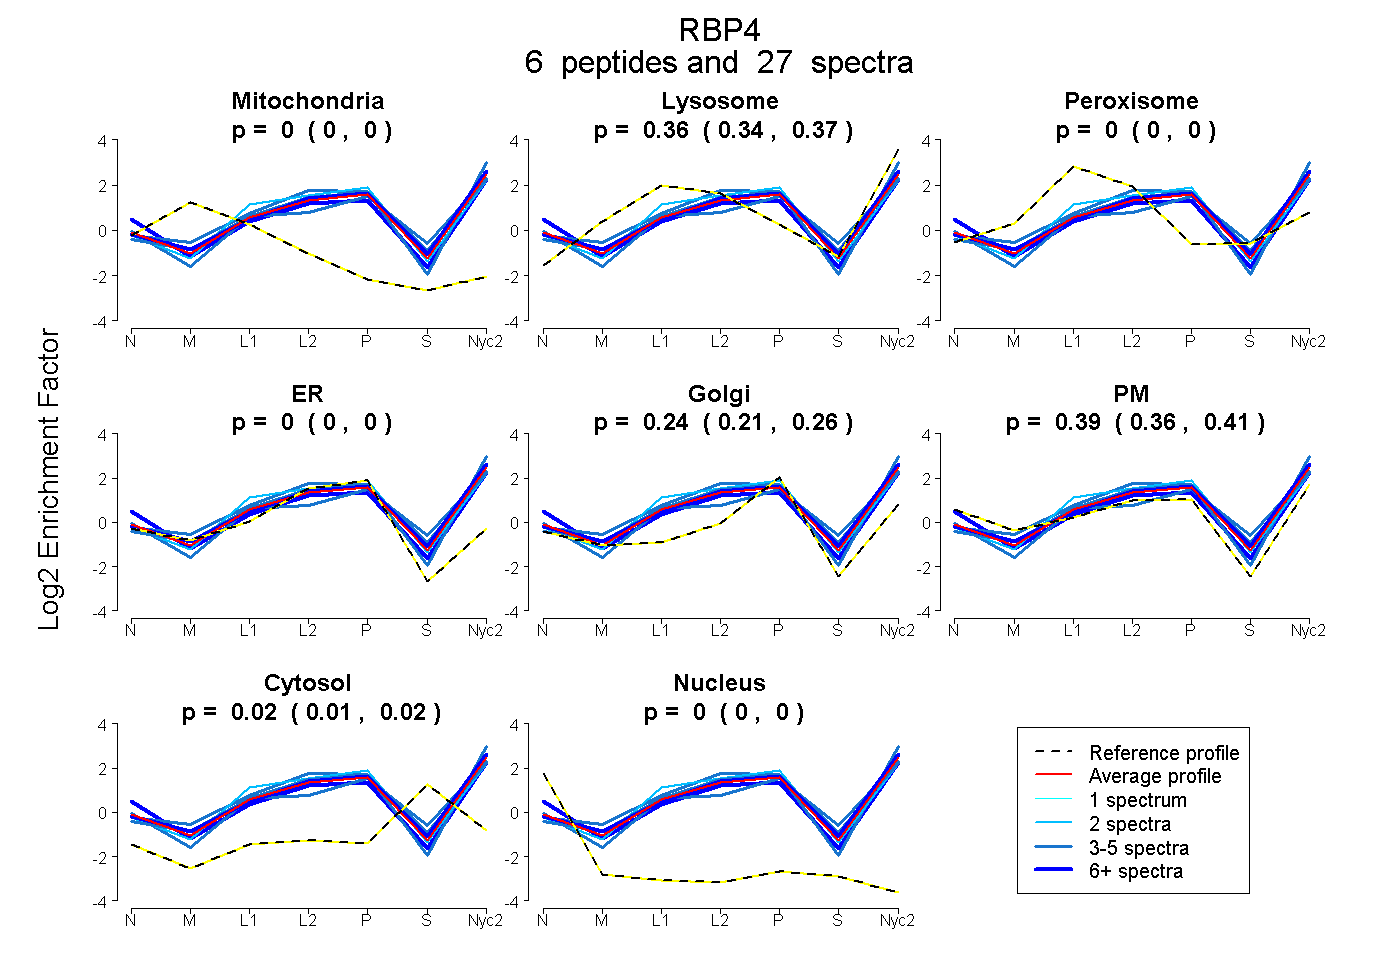 |
0.000
0.000 | 0.000 |
0.359
0.343 | 0.371 |
|
0.000
0.000 | 0.000 |
0.000
0.000 | 0.000 |
0.239
0.214 | 0.257 |
0.388
0.357 | 0.414 |
0.015
0.005 | 0.023 |
0.000
0.000 | 0.000 |
|
| | | Plot |
Mito |
|
Lyso or Perox |
|
ER |
Golgi |
PM |
Cytosol |
Nucleus |
|
| Expt B |
4
peptides |
16
spectra |
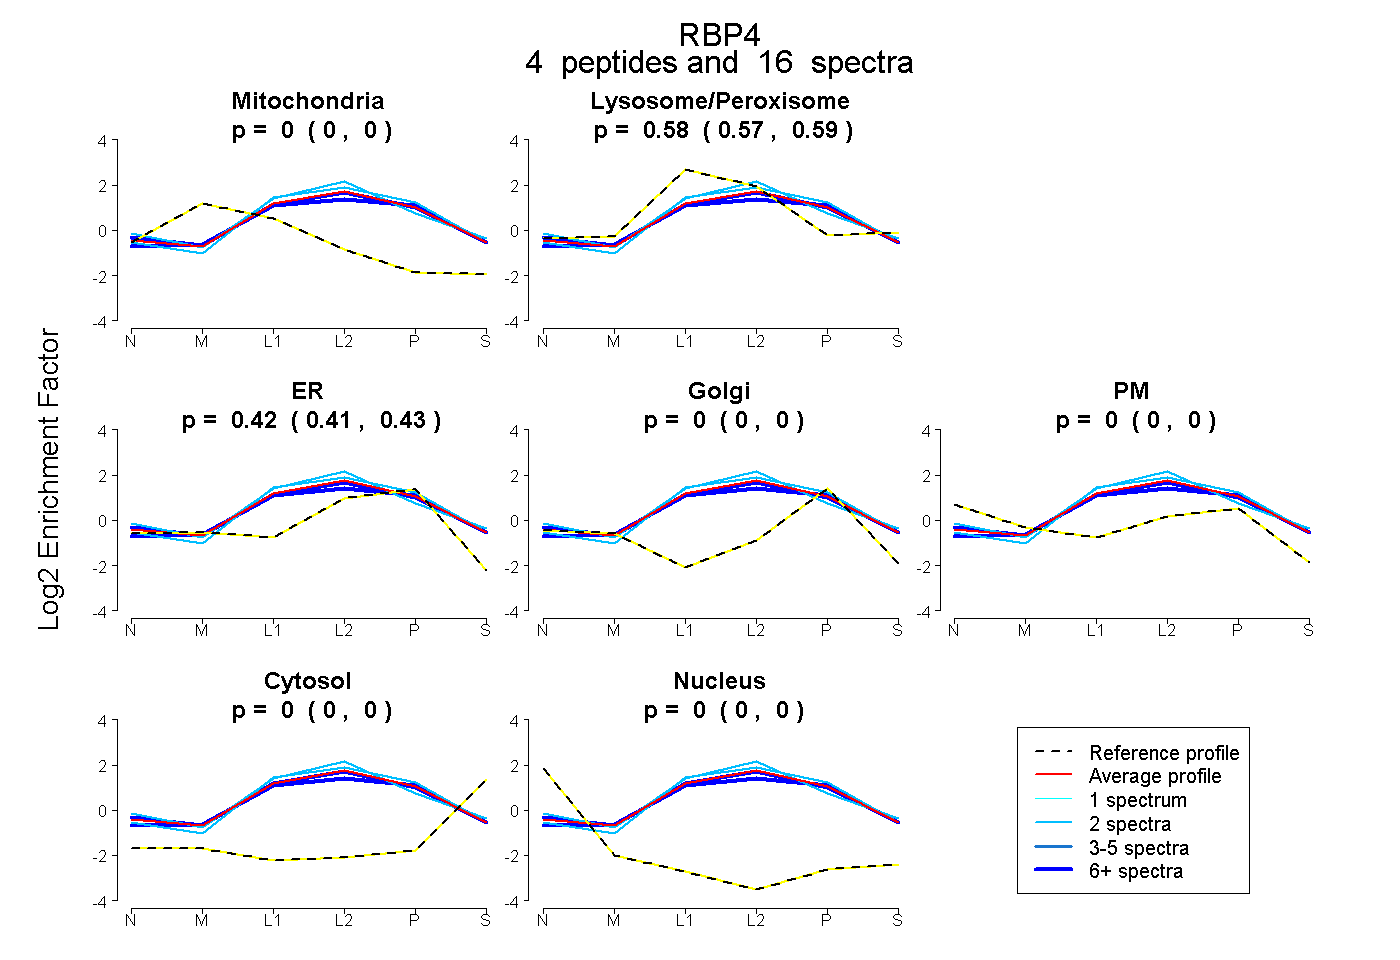 |
0.000
0.000 | 0.000 |
|
0.580
0.571 | 0.587 |
|
0.420
0.410 | 0.427 |
0.000
0.000 | 0.000 |
0.000
0.000 | 0.000 |
0.000
0.000 | 0.000 |
0.000
0.000 | 0.000 |
|
| | | Plot |
|
Lyso |
|
|
|
|
|
|
|
Other |
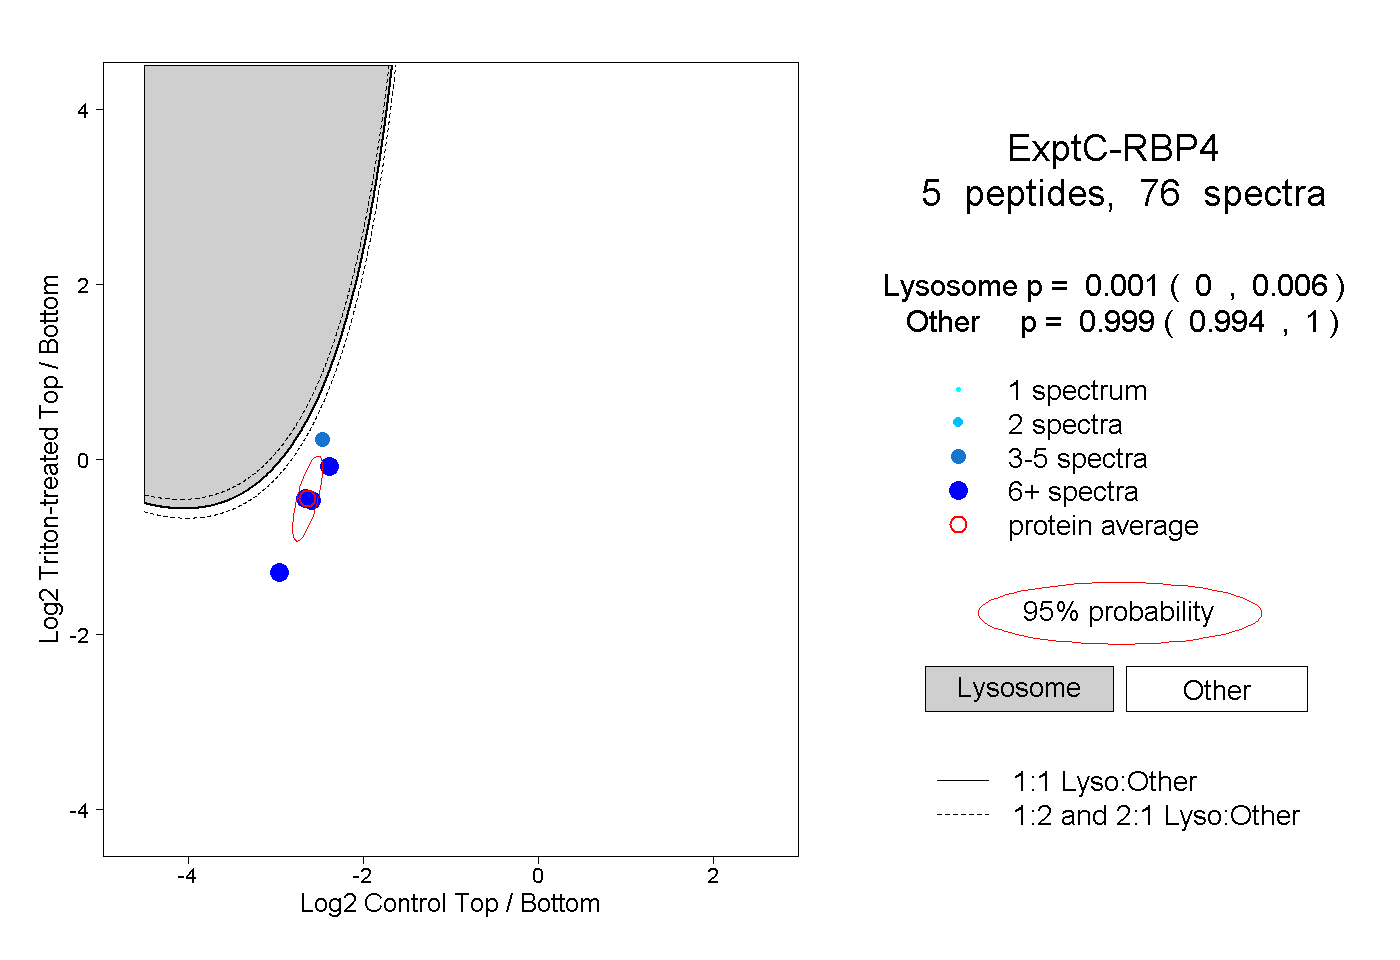
| Expt C |
5
peptides |
76
spectra |
 |
|
0.001
0.000 | 0.006 |
|
|
|
|
|
|
|
0.999
0.994 | 1.000 |
| 8 spectra, QEELCLER |
|
0.000 |
|
|
|
|
|
|
|
1.000 |
| 5 spectra, FSGLWYAIAK |
|
0.011 |
|
|
|
|
|
|
|
0.989 |
| 7 spectra, GHMSATAK |
|
0.000 |
|
|
|
|
|
|
|
1.000 |
| 10 spectra, YWGVASFLQR |
|
0.000 |
|
|
|
|
|
|
|
1.000 |
| 46 spectra, DPNGLTPETR |
|
0.001 |
|
|
|
|
|
|
|
0.999 |
| | | Plot |
|
Lyso |
|
|
|
|
|
|
|
Other |
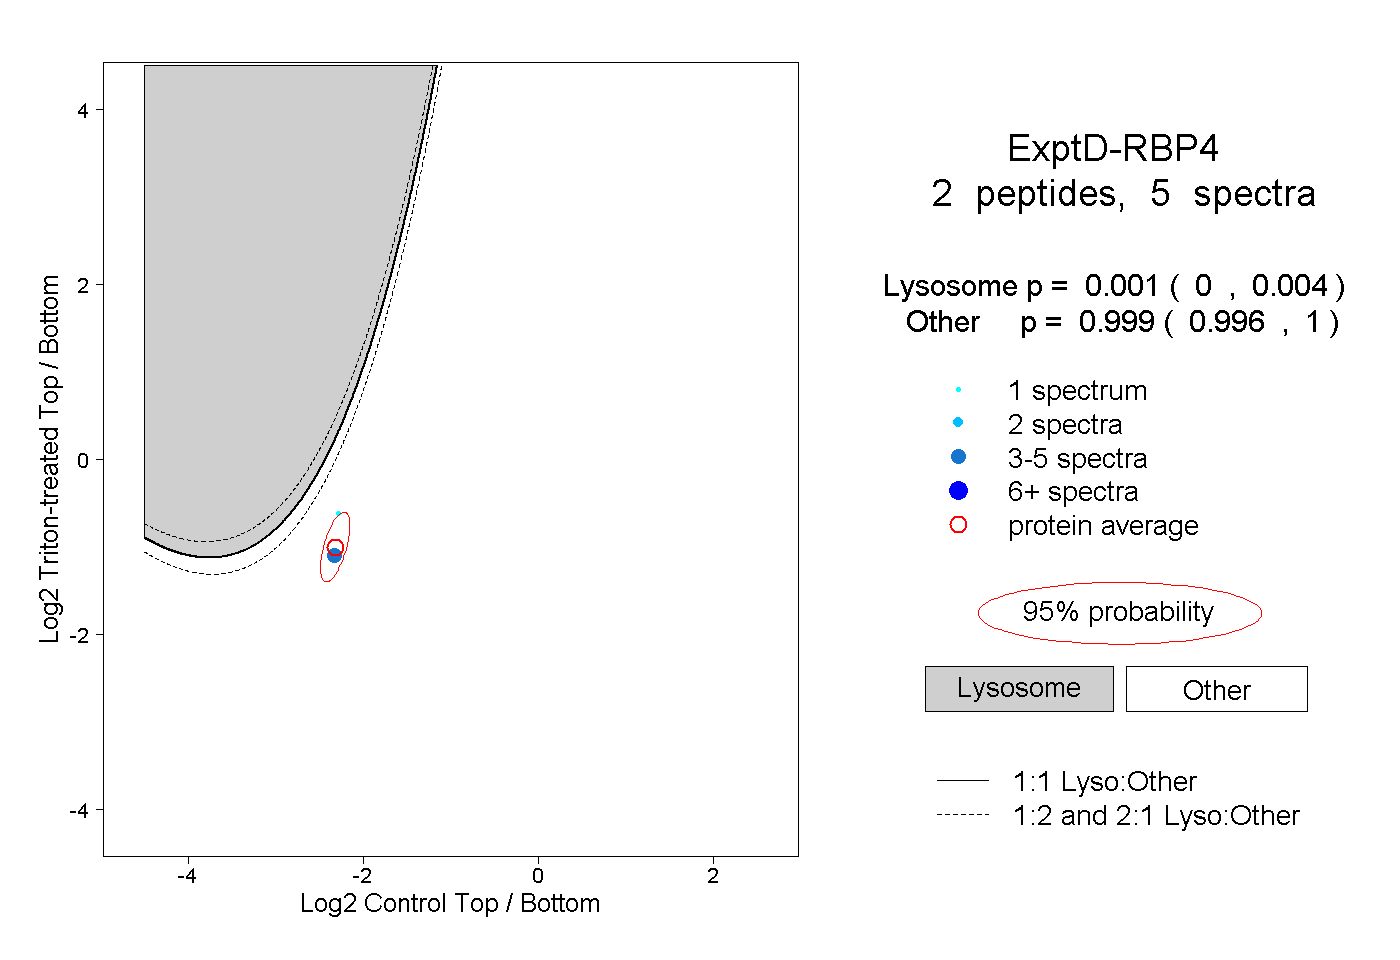
| Expt D |
2
peptides |
5
spectra |
 |
|
0.001
0.000 | 0.004 |
|
|
|
|
|
|
|
0.999
0.996 | 1.000 |