 3
3peptides
spectra
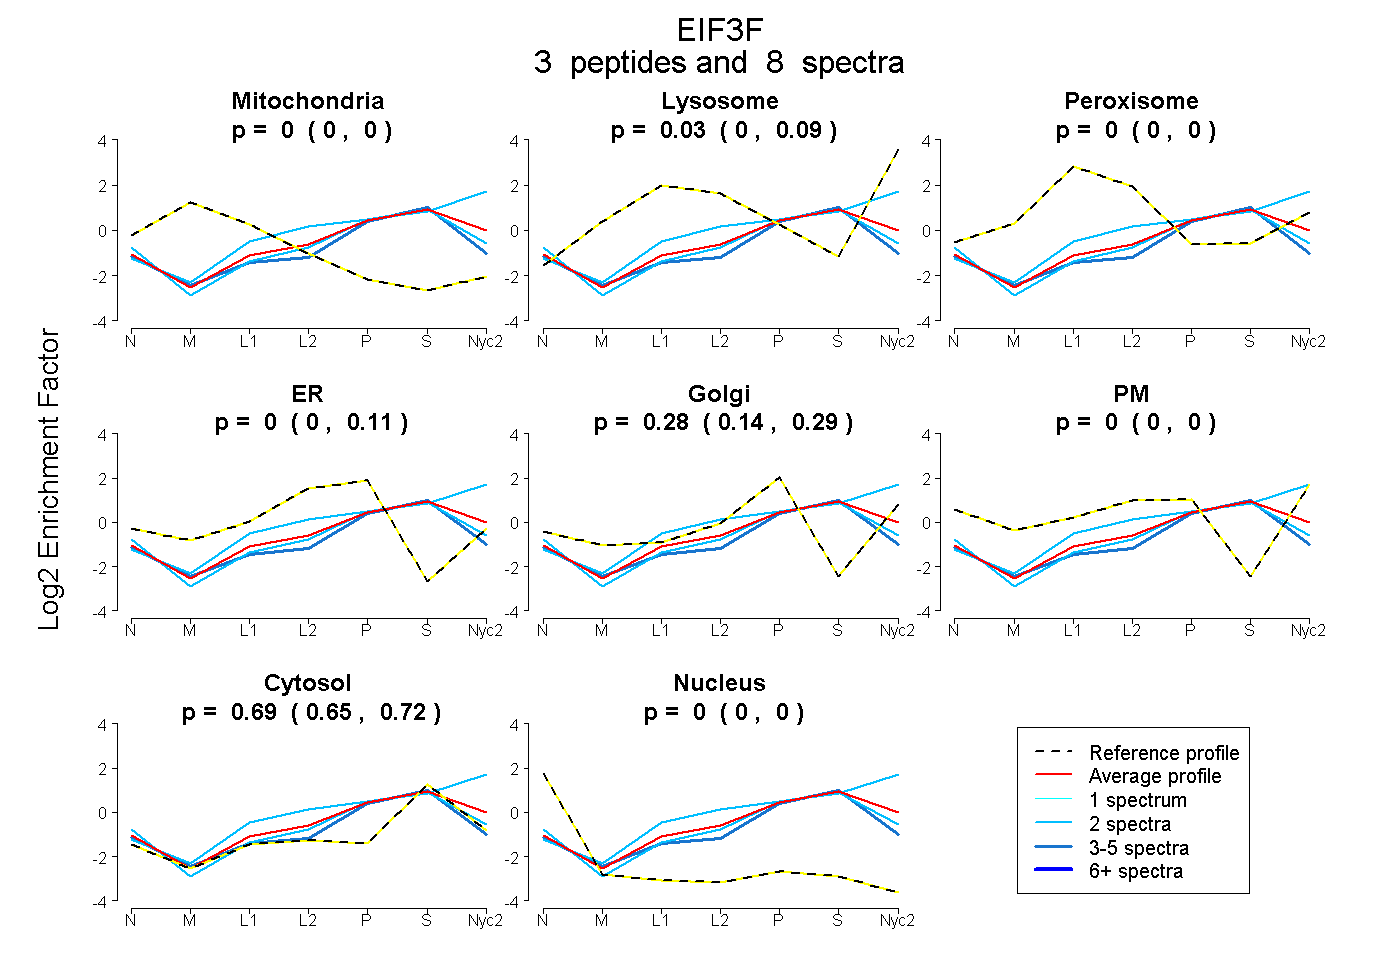
0.000 | 0.000
0.000 | 0.090
0.000 | 0.000
0.000 | 0.111
0.139 | 0.295
0.000 | 0.000
0.651 | 0.722
0.000 | 0.000
3peptides
spectra
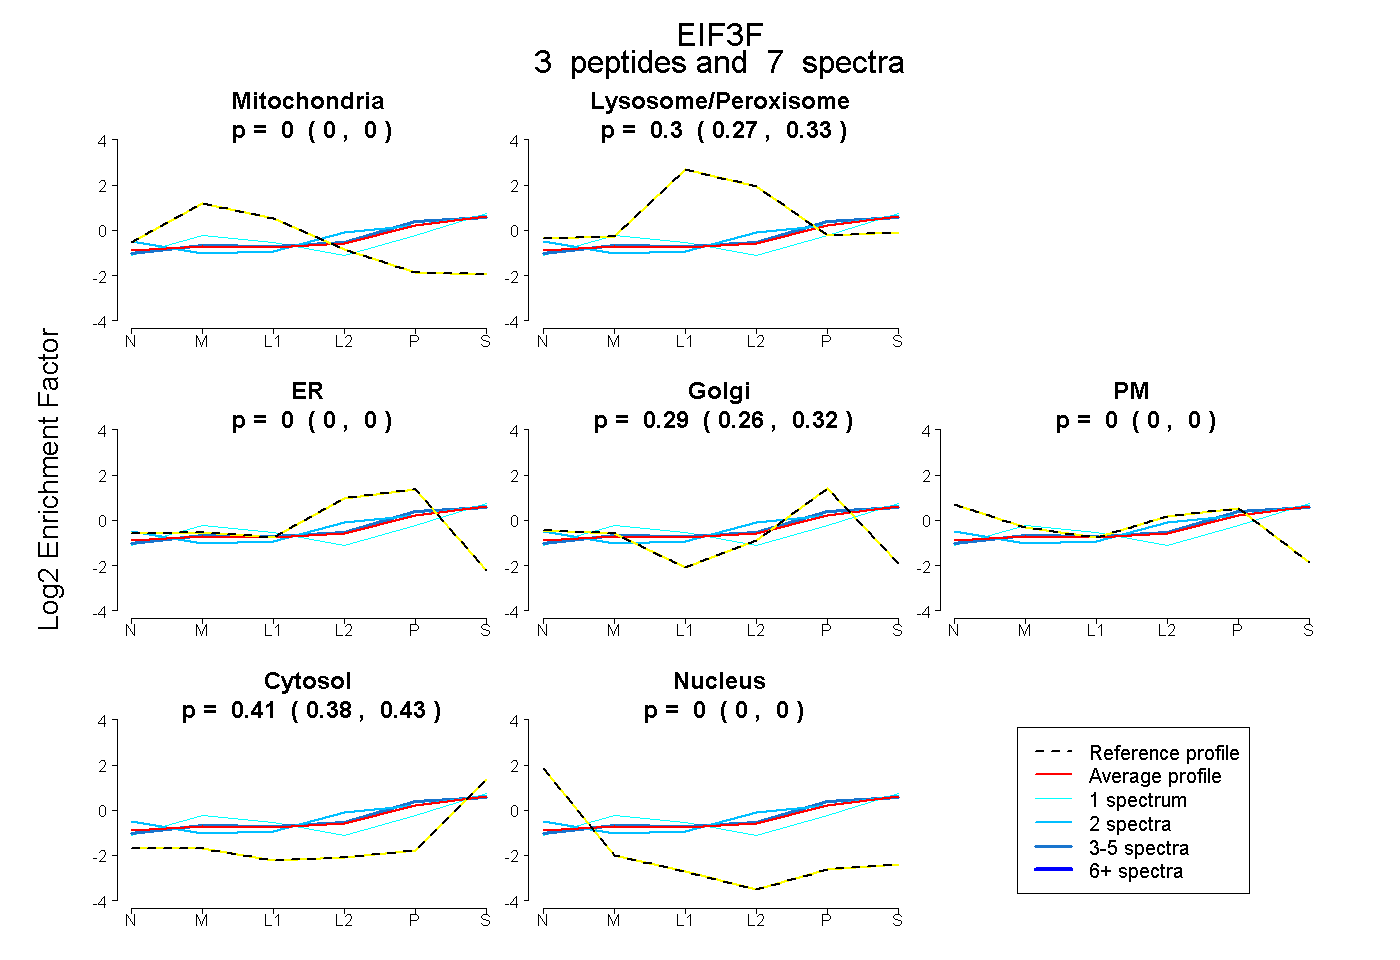
0.000 | 0.000
0.265 | 0.326
0.000 | 0.000
0.263 | 0.317
0.000 | 0.000
0.383 | 0.432
0.000 | 0.000
3peptides
spectra
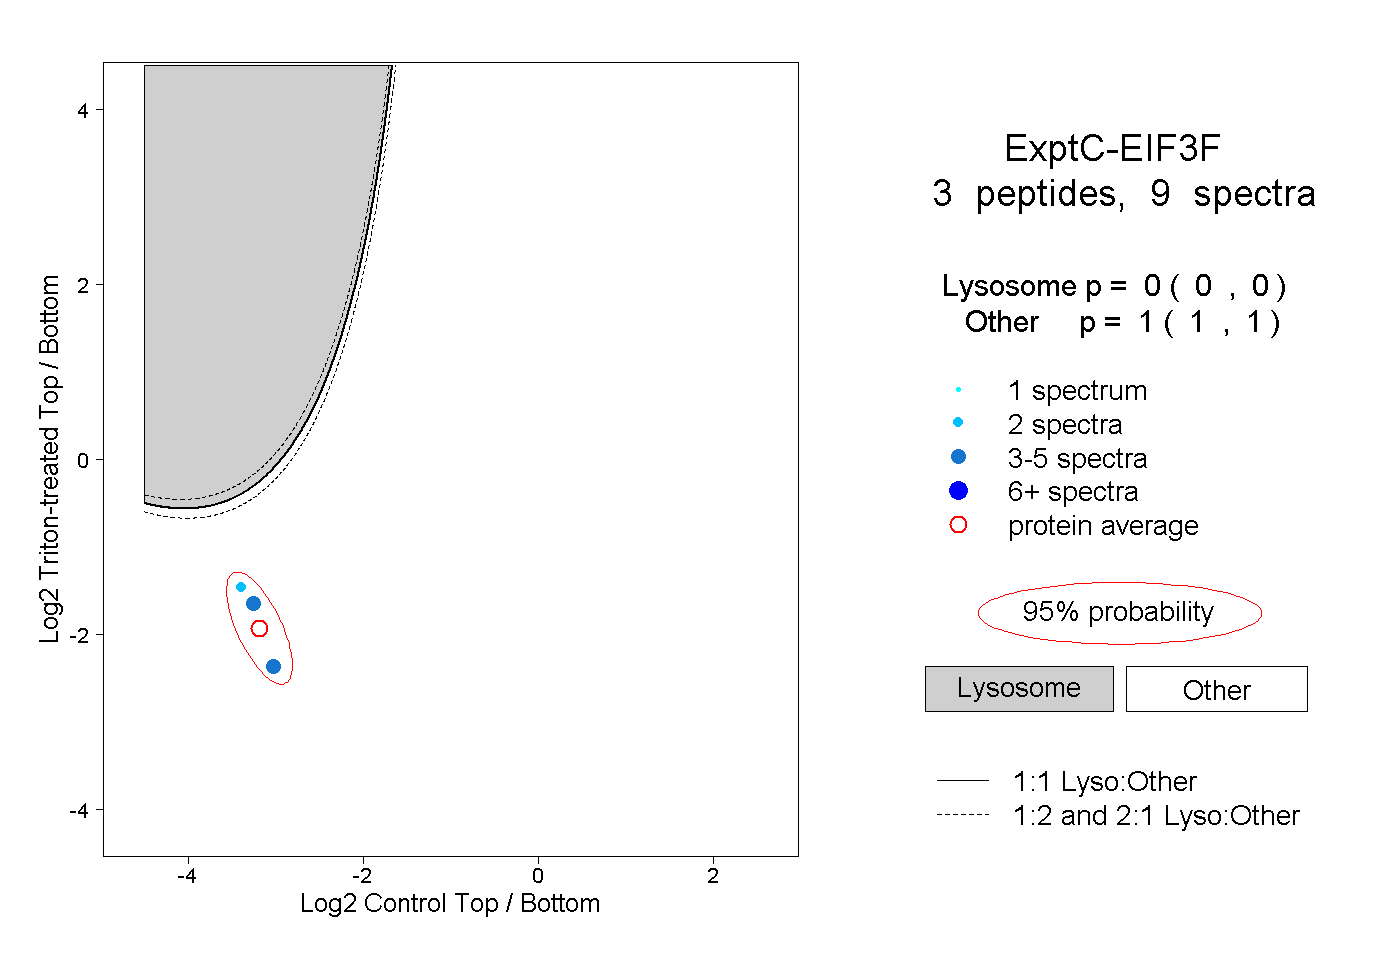
0.000 | 0.000
1.000 | 1.000