 3
3peptides
spectra
0.000 | 0.000
0.000 | 0.090
0.000 | 0.000
0.000 | 0.111
0.139 | 0.295
0.000 | 0.000
0.651 | 0.722
0.000 | 0.000
| Plot | Mito | Lyso | Perox | ER | Golgi | PM | Cytosol | Nucleus | |||||
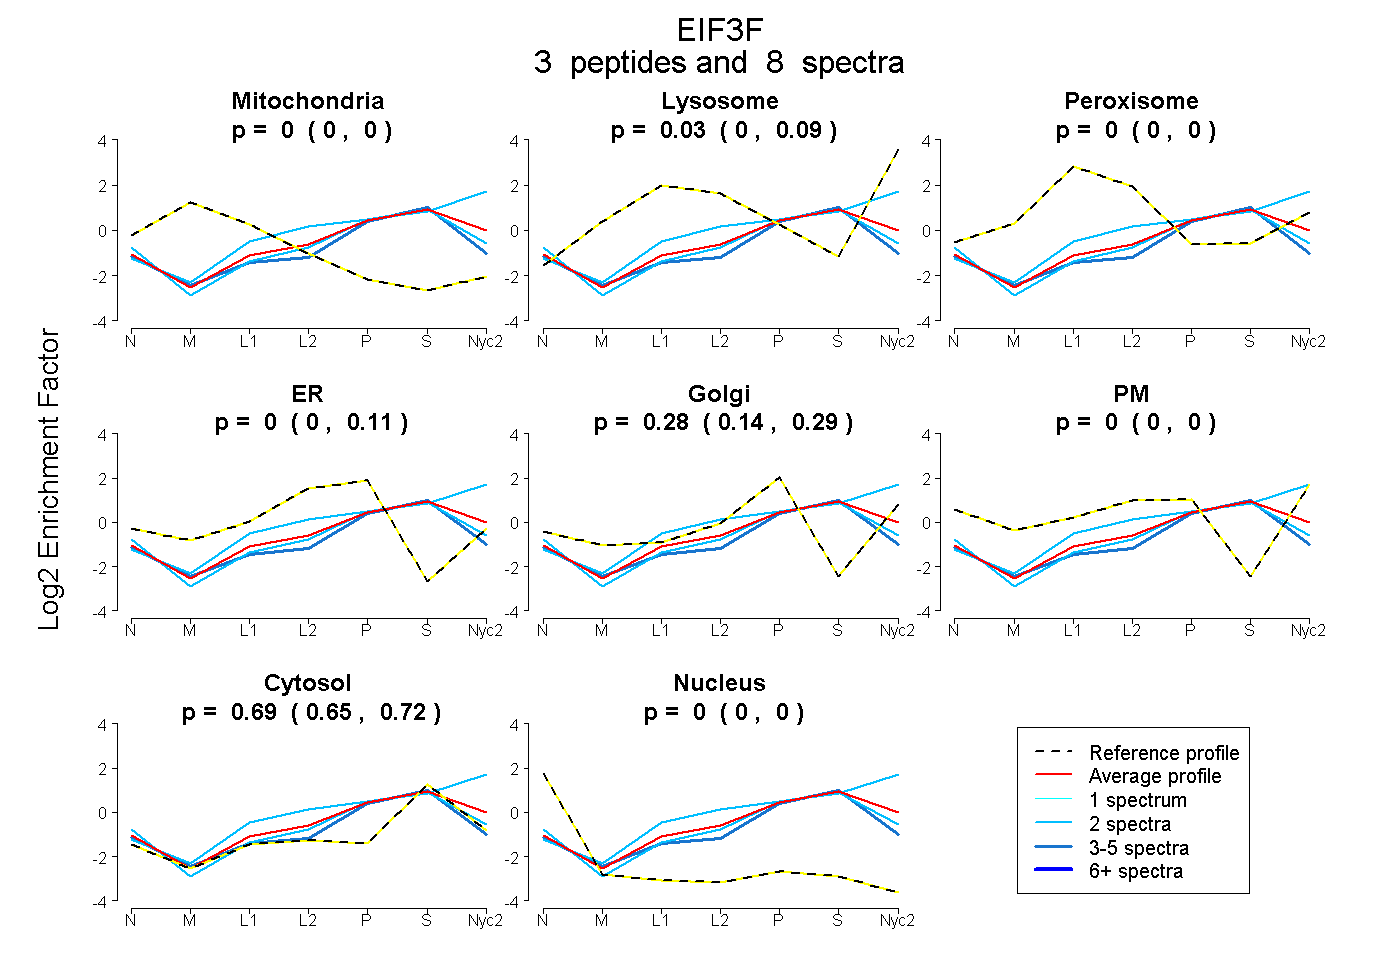
| Expt A |
3 peptides |
8 spectra |
|
0.000 0.000 | 0.000 |
0.032 0.000 | 0.090 |
0.000 0.000 | 0.000 |
0.000 0.000 | 0.111 |
0.279 0.139 | 0.295 |
0.000 0.000 | 0.000 |
0.688 0.651 | 0.722 |
0.000 0.000 | 0.000 |
| 4 spectra, AYVSTLMGVPGR | 0.000 | 0.000 | 0.000 | 0.000 | 0.222 | 0.000 | 0.778 | 0.000 | ||
| 2 spectra, VIGTLLGTVDK | 0.000 | 0.000 | 0.000 | 0.011 | 0.259 | 0.000 | 0.730 | 0.000 | ||
| 2 spectra, LHPVILASIVDSYER | 0.000 | 0.342 | 0.000 | 0.000 | 0.129 | 0.000 | 0.529 | 0.000 |
| Plot | Mito | Lyso or Perox | ER | Golgi | PM | Cytosol | Nucleus | ||||||
| Expt B |
3 peptides |
7 spectra |
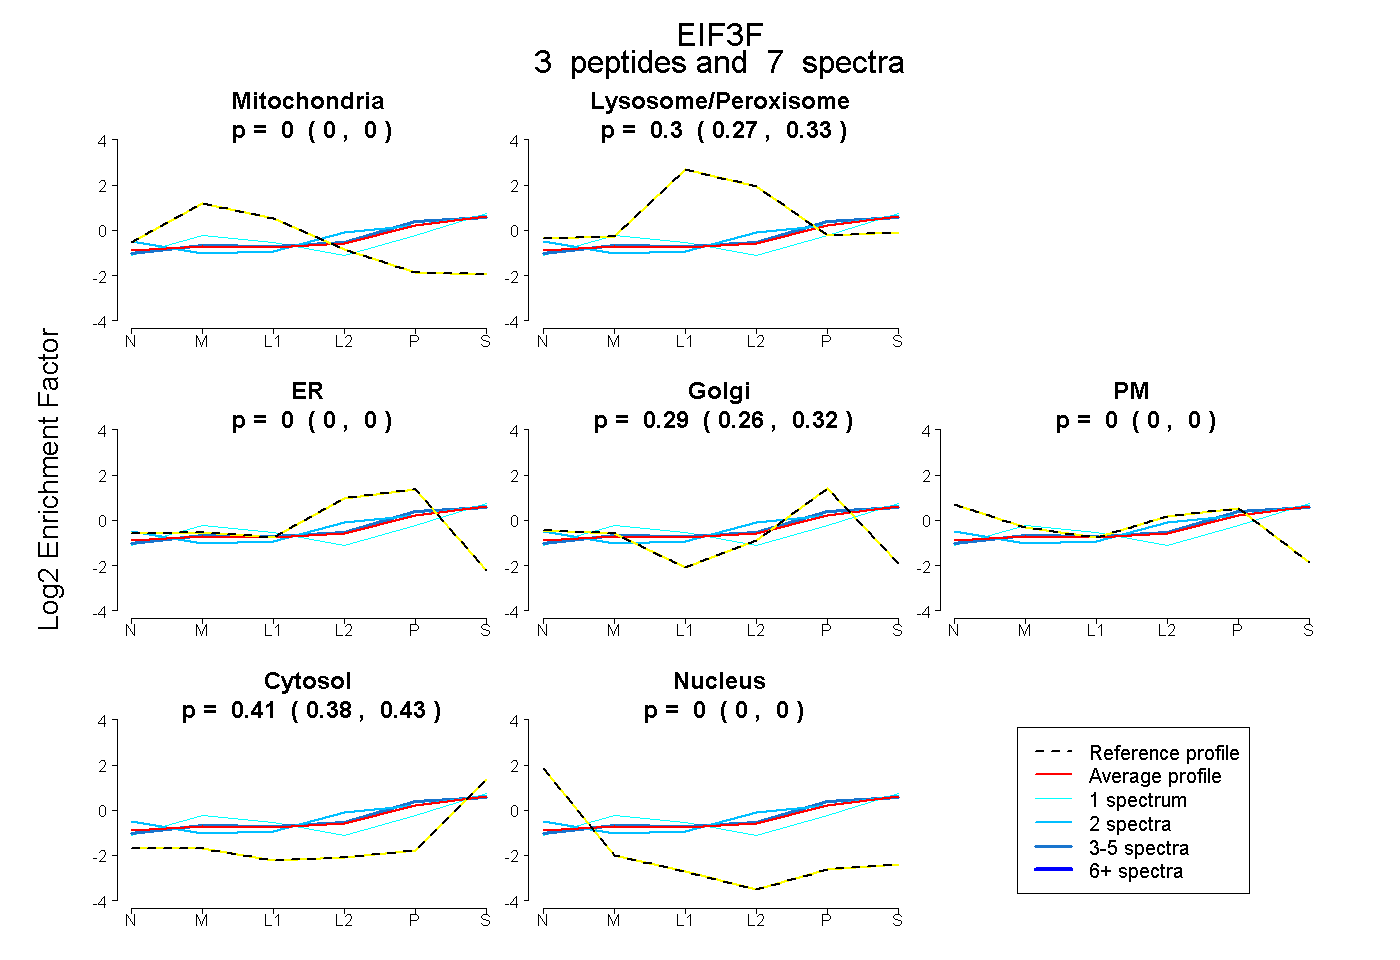 |
0.000 0.000 | 0.000 |
0.298 0.265 | 0.326 |
0.000 0.000 | 0.000 |
0.292 0.263 | 0.317 |
0.000 0.000 | 0.000 |
0.410 0.383 | 0.432 |
0.000 0.000 | 0.000 |
|||
| Plot | Lyso | Other | |||||||||||
| Expt C |
3 peptides |
9 spectra |
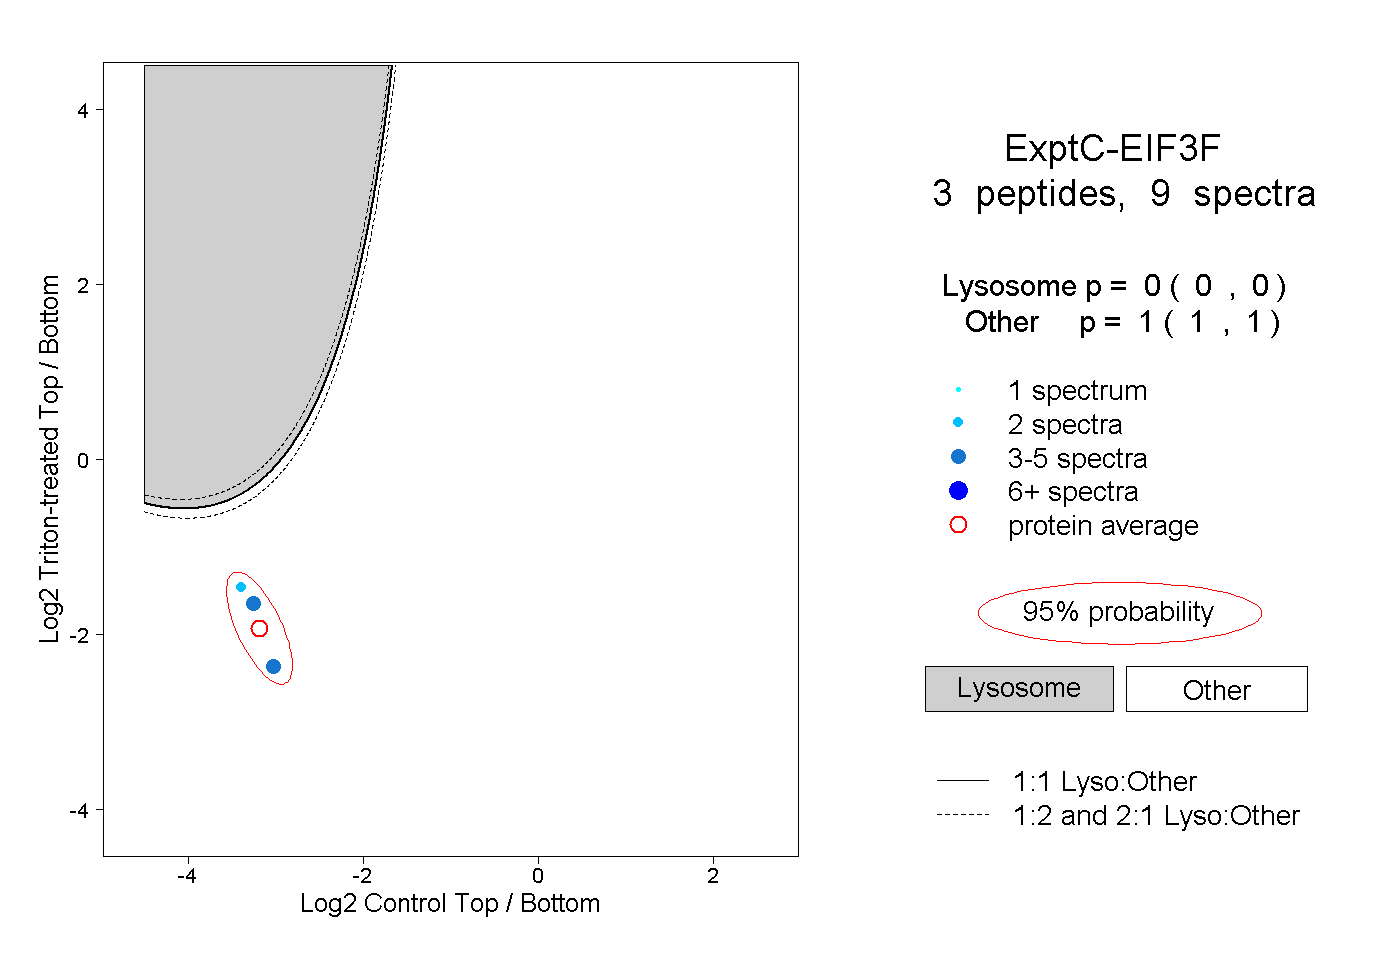 |
0.000 0.000 | 0.000 |
1.000 1.000 | 1.000 |