 2
2peptides
spectra
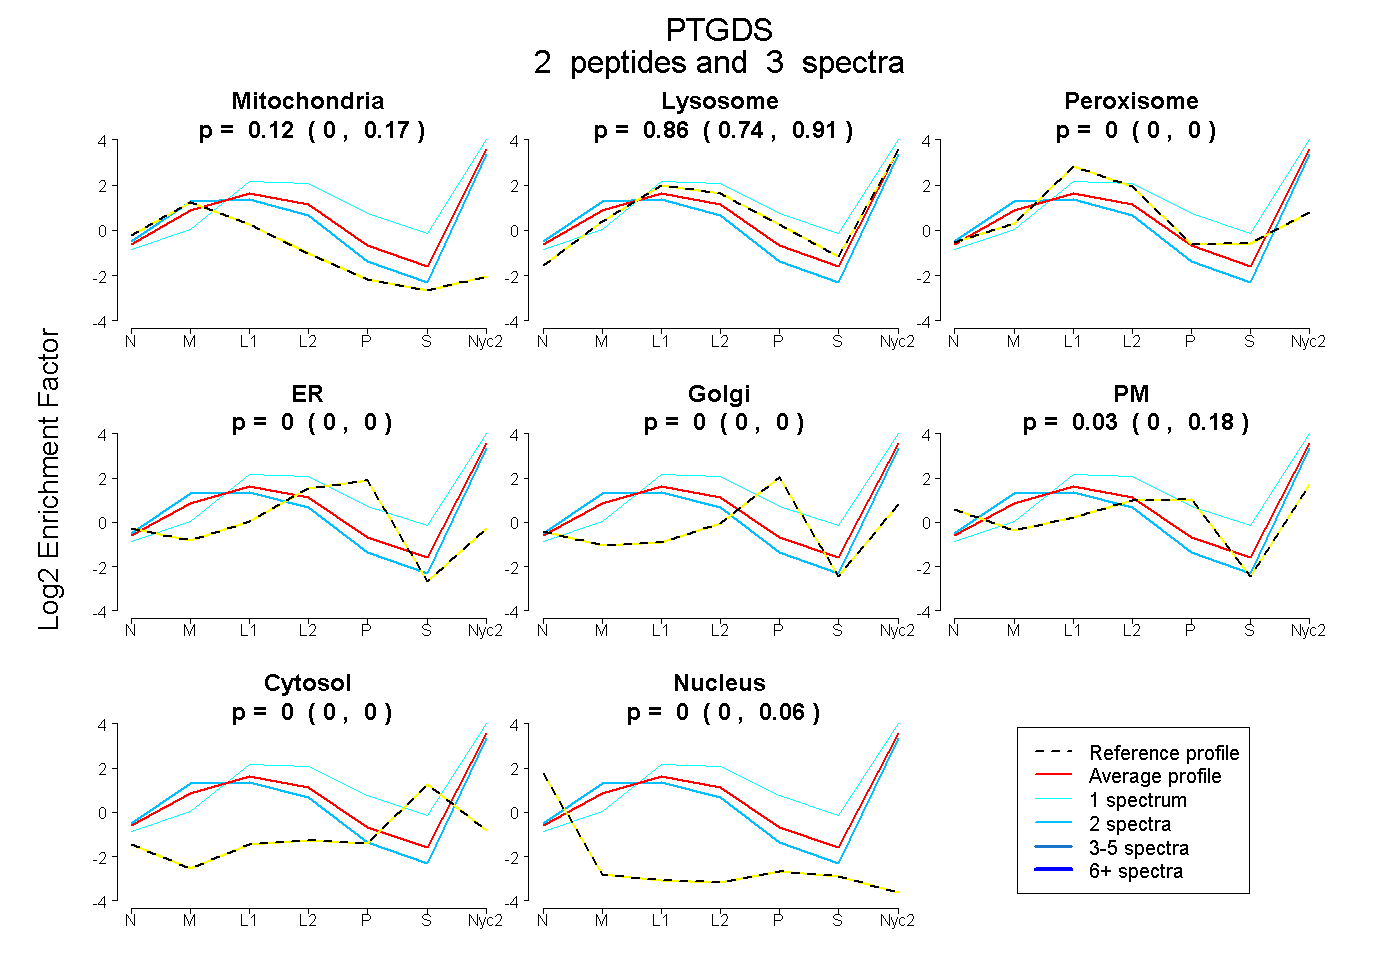
0.000 | 0.166
0.743 | 0.912
0.000 | 0.001
0.000 | 0.000
0.000 | 0.000
0.000 | 0.175
0.000 | 0.000
0.000 | 0.056
3peptides
spectra
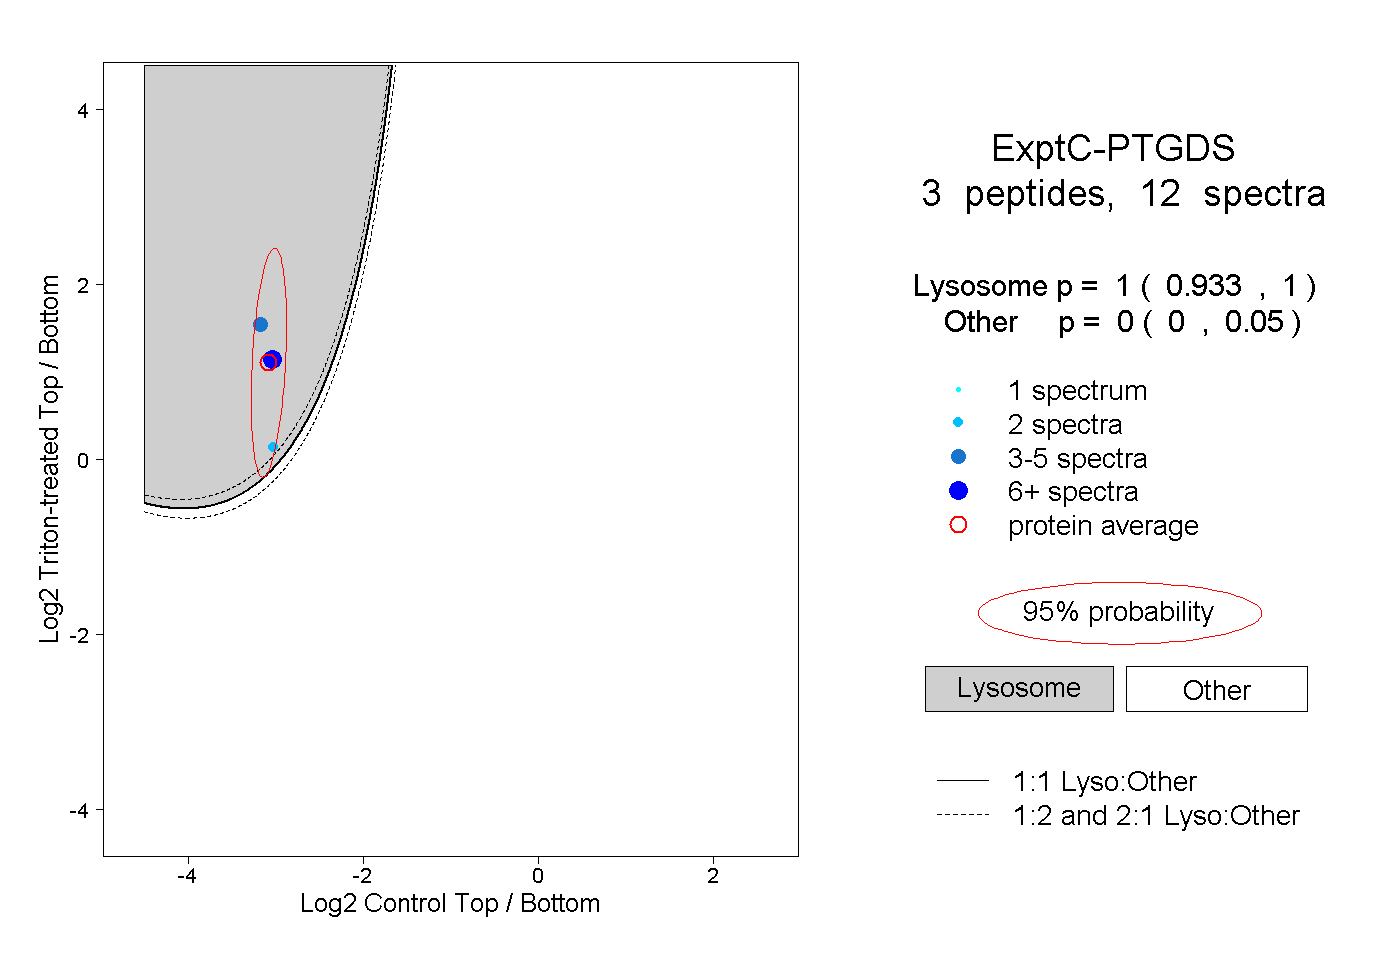
0.933 | 1.000
0.000 | 0.050
1peptide
spectrum
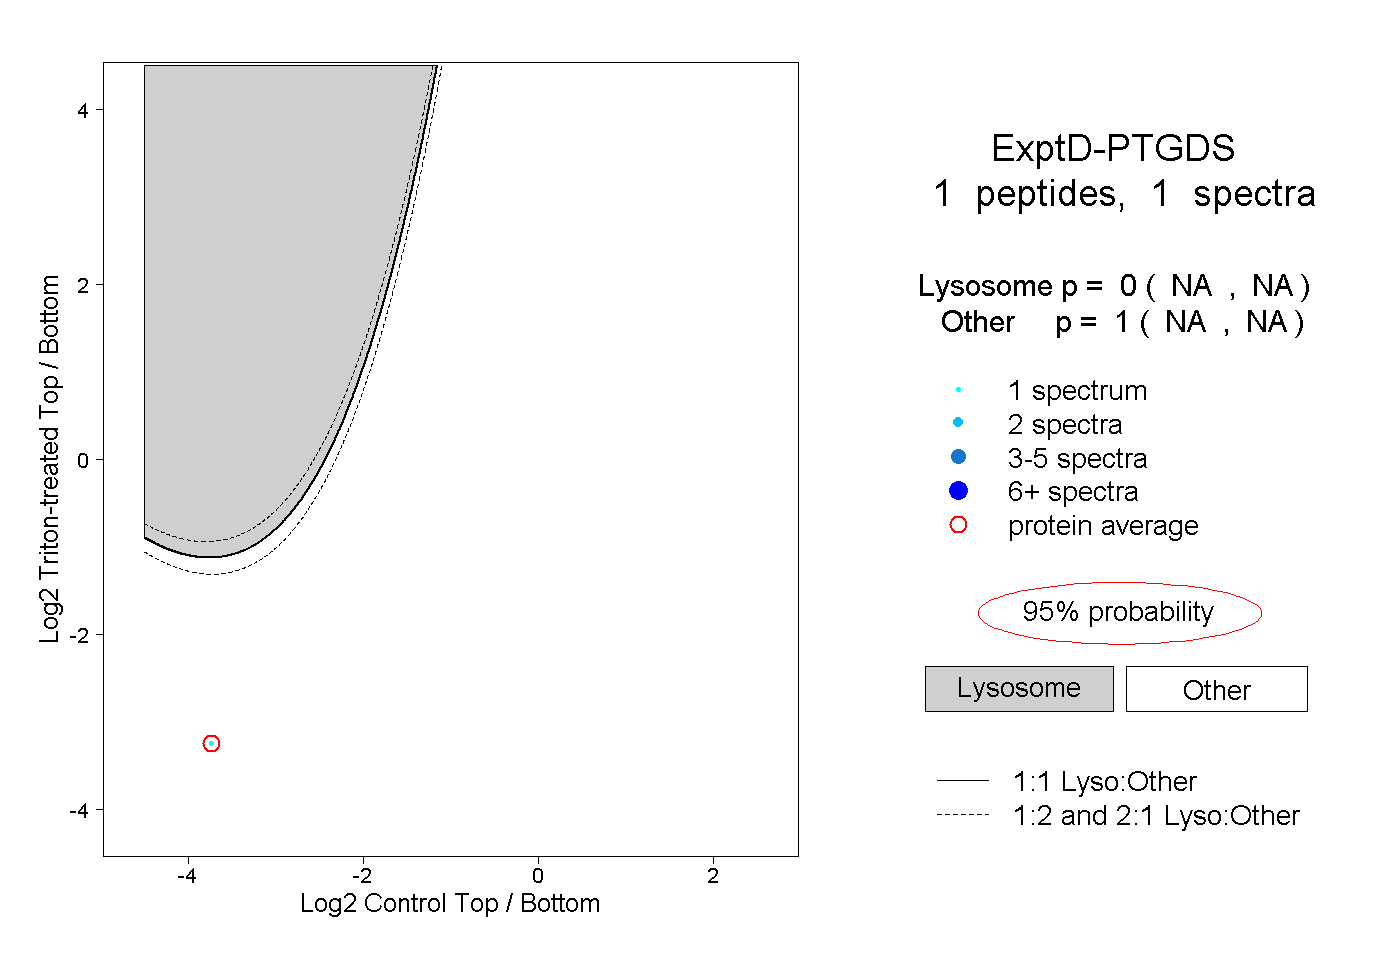
NA | NA
NA | NA