 2
2peptides
spectra
0.000 | 0.166
0.743 | 0.912
0.000 | 0.001
0.000 | 0.000
0.000 | 0.000
0.000 | 0.175
0.000 | 0.000
0.000 | 0.056
| Plot | Mito | Lyso | Perox | ER | Golgi | PM | Cytosol | Nucleus | |||||
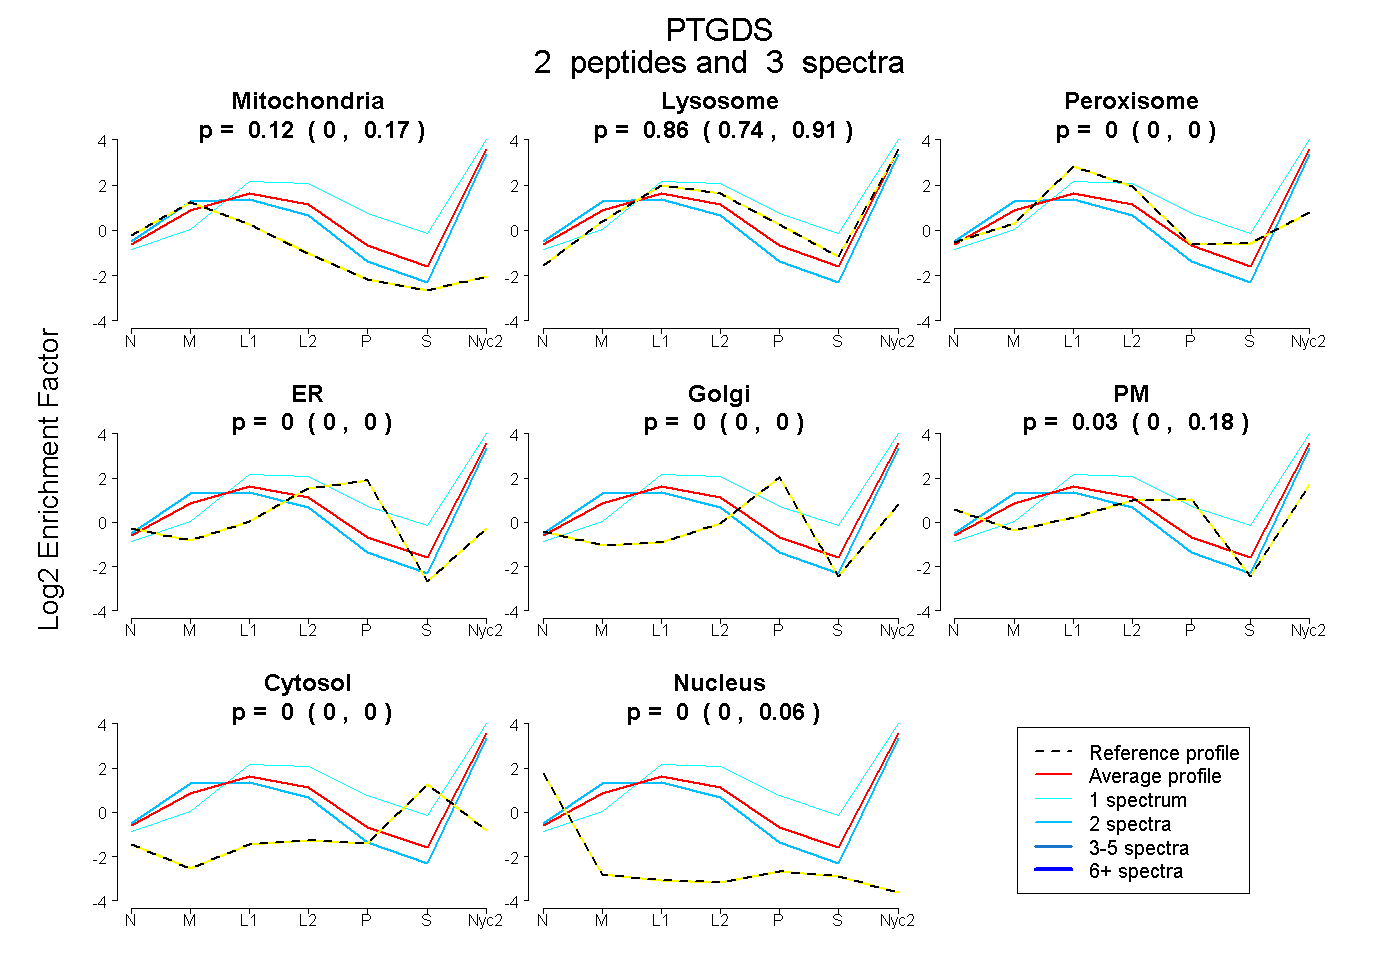
| Expt A |
2 peptides |
3 spectra |
|
0.117 0.000 | 0.166 |
0.855 0.743 | 0.912 |
0.000 0.000 | 0.001 |
0.000 0.000 | 0.000 |
0.000 0.000 | 0.000 |
0.028 0.000 | 0.175 |
0.000 0.000 | 0.000 |
0.000 0.000 | 0.056 |
| 2 spectra, MATLYSR | 0.246 | 0.754 | 0.000 | 0.000 | 0.000 | 0.000 | 0.000 | 0.000 | ||
| 1 spectrum, FITFSK | 0.000 | 1.000 | 0.000 | 0.000 | 0.000 | 0.000 | 0.000 | 0.000 |
| Plot | Lyso | Other | |||||||||||
| Expt C |
3 peptides |
12 spectra |
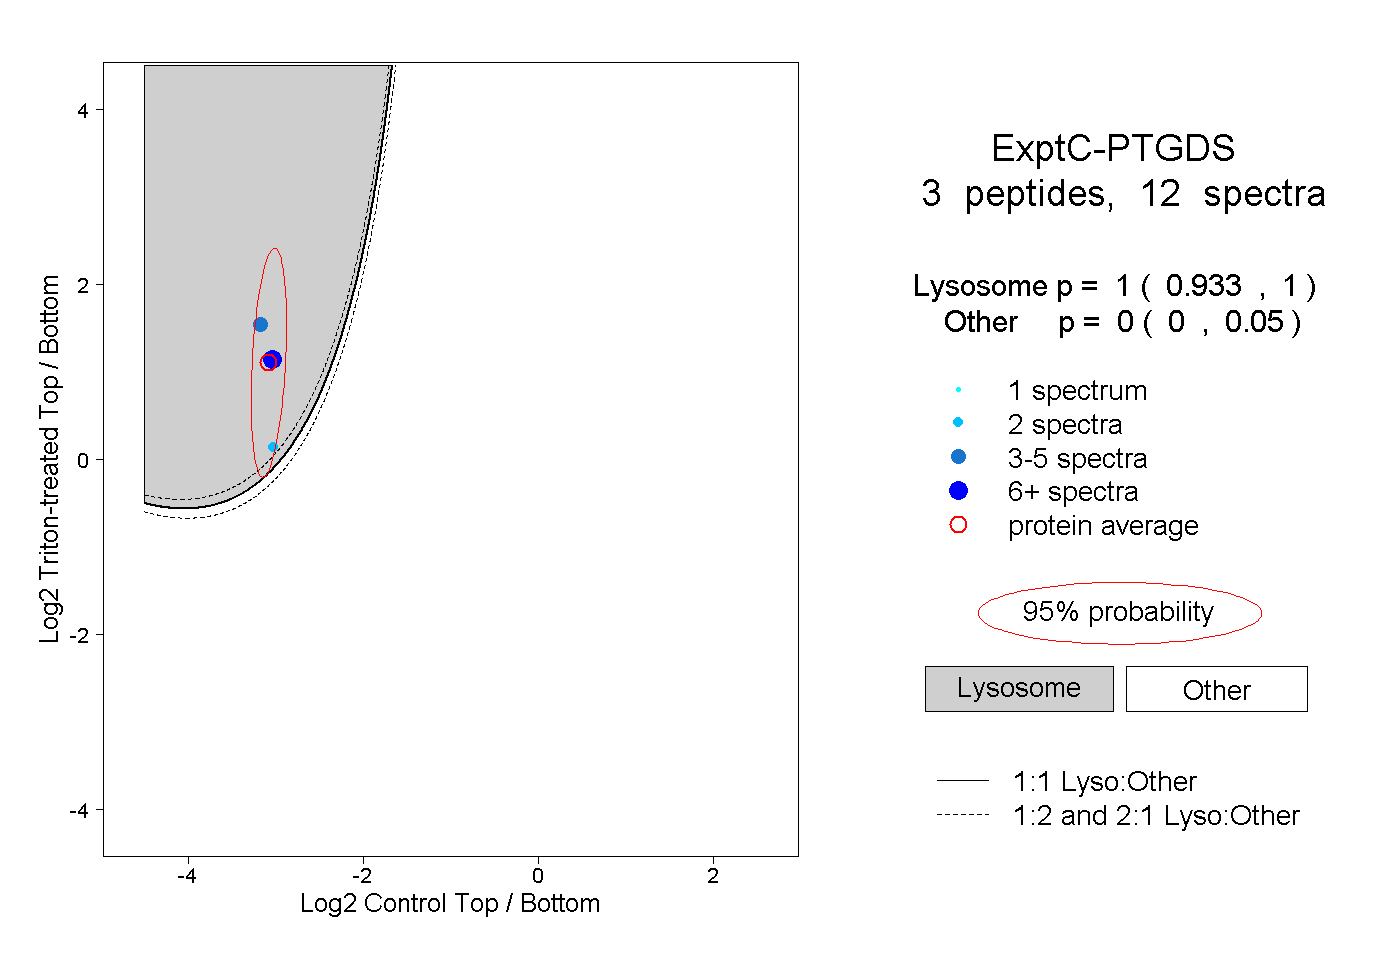 |
1.000 0.933 | 1.000 |
0.000 0.000 | 0.050 |
||||||||
| Plot | Lyso | Other | |||||||||||
| Expt D |
1 peptide |
1 spectrum |
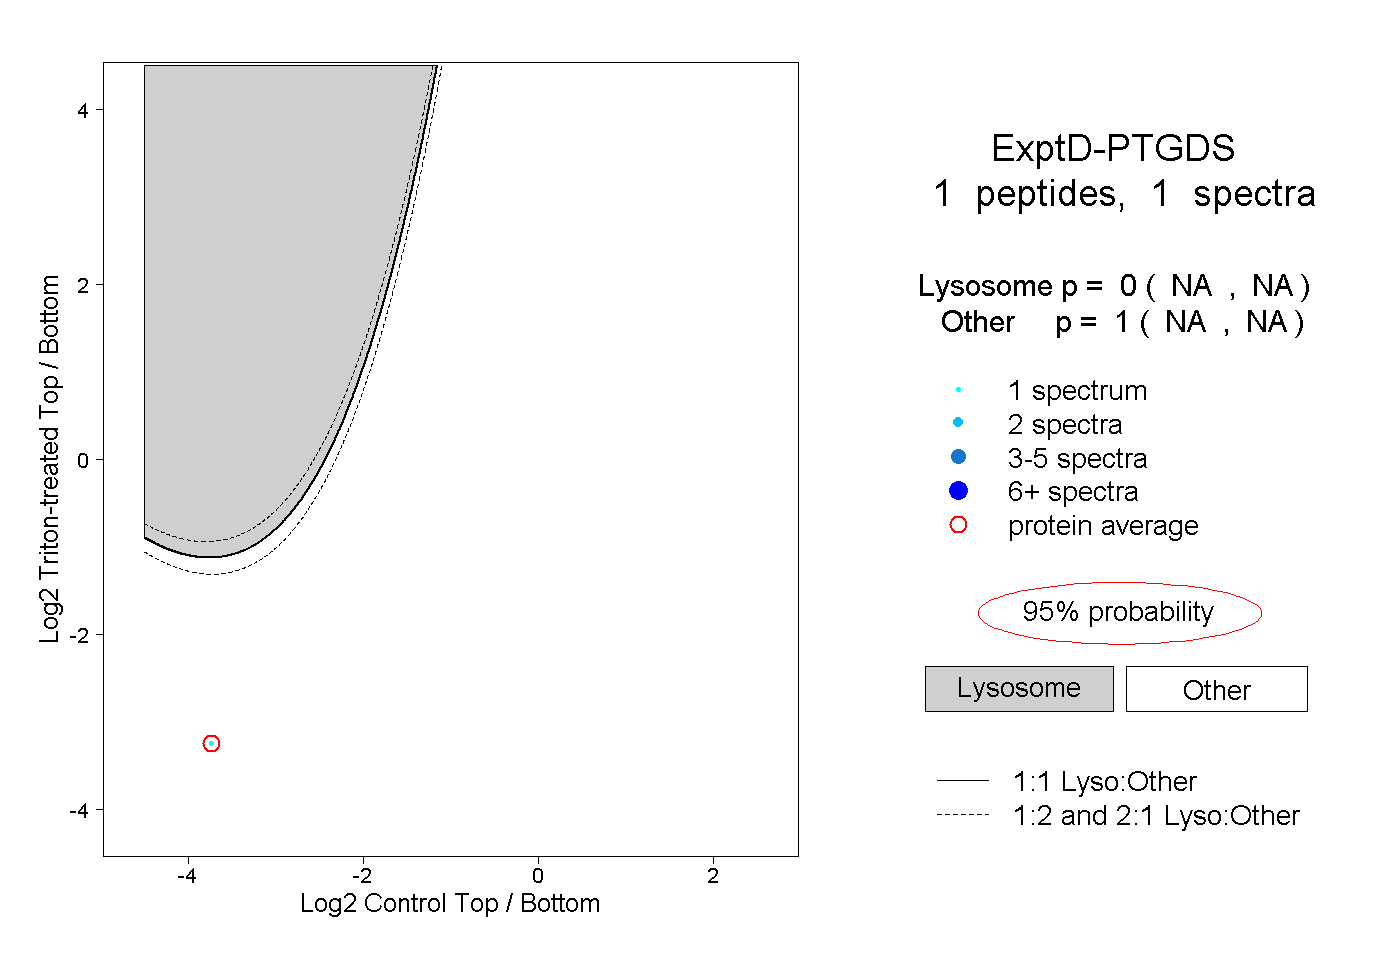 |
0.000 NA | NA |
1.000 NA | NA |