 9
9peptides
spectra
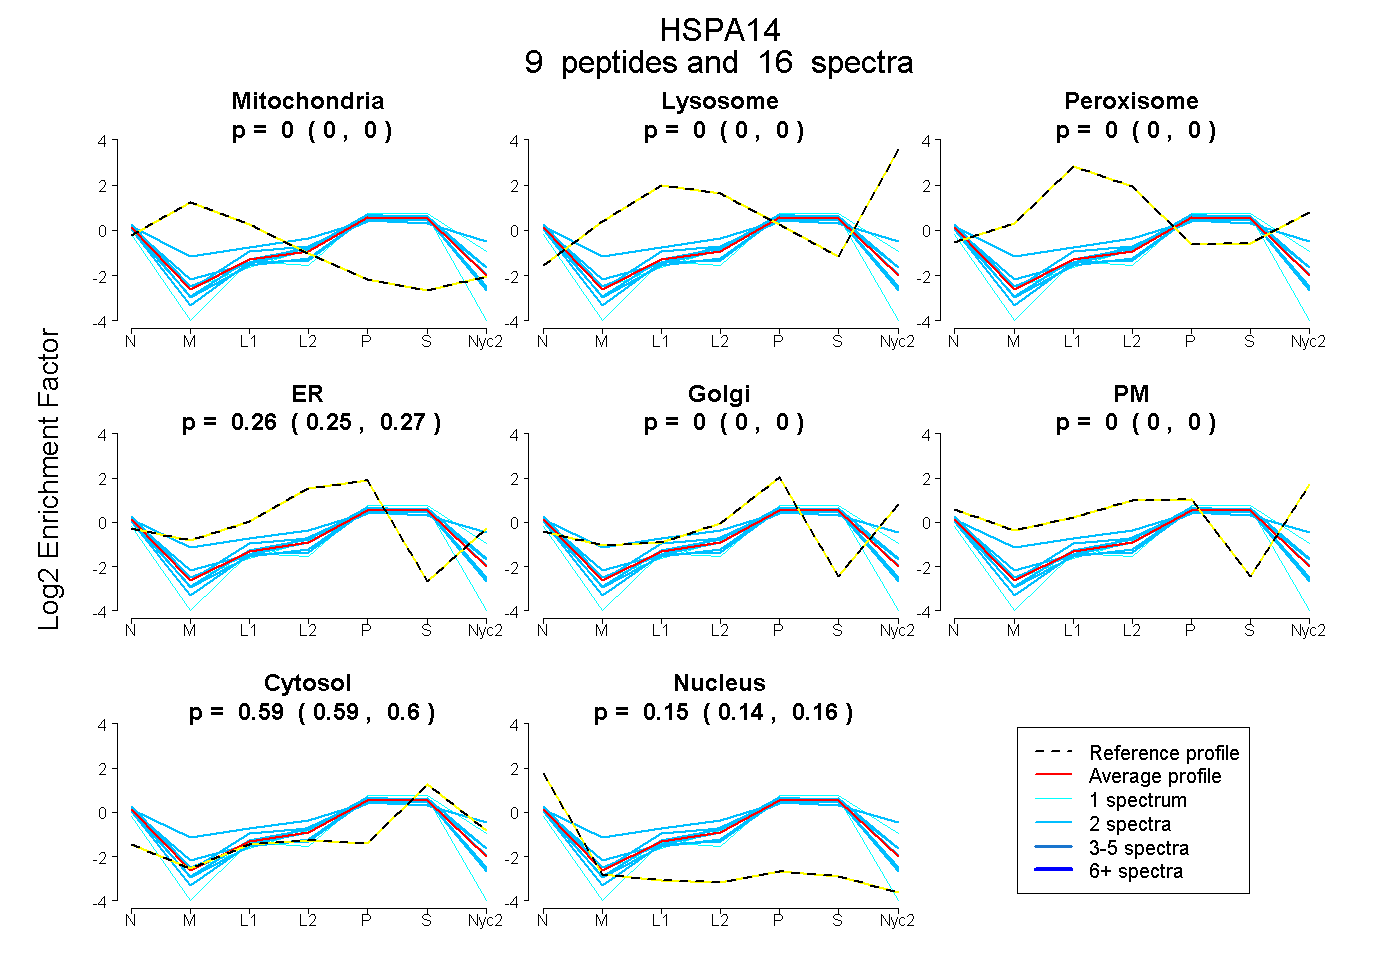
0.000 | 0.000
0.000 | 0.000
0.000 | 0.000
0.251 | 0.266
0.000 | 0.000
0.000 | 0.000
0.586 | 0.601
0.137 | 0.156
2peptides
spectra
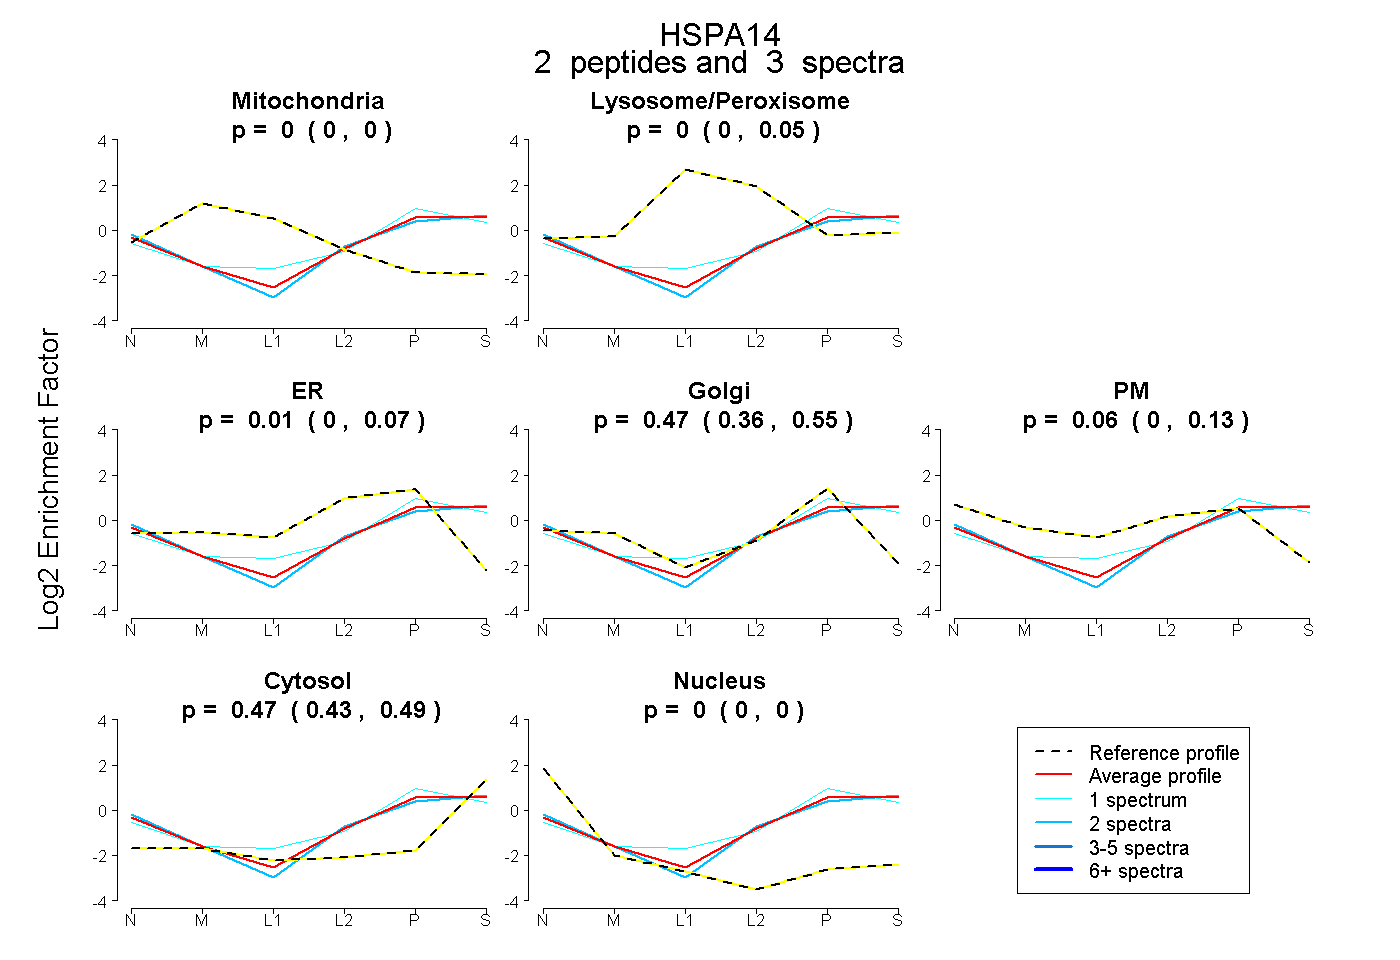
0.000 | 0.000
0.000 | 0.050
0.000 | 0.070
0.355 | 0.547
0.000 | 0.127
0.426 | 0.494
0.000 | 0.000
4peptides
spectra

0.000 | 0.000
1.000 | 1.000
4peptides
spectra
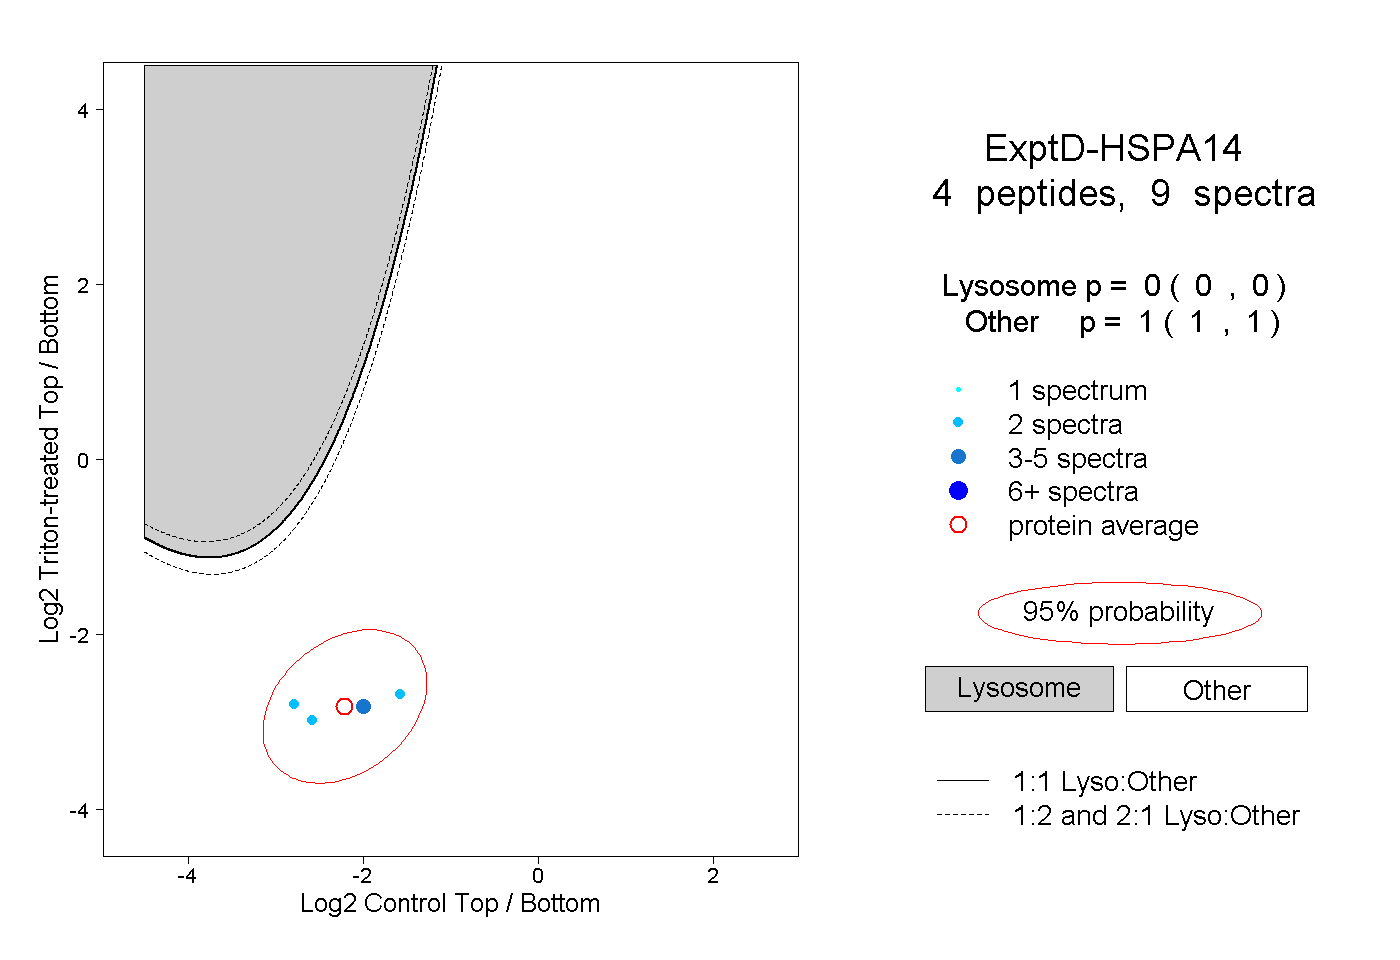
0.000 | 0.000
1.000 | 1.000