 9
9peptides
spectra
0.000 | 0.000
0.000 | 0.000
0.000 | 0.000
0.251 | 0.266
0.000 | 0.000
0.000 | 0.000
0.586 | 0.601
0.137 | 0.156
| Plot | Mito | Lyso | Perox | ER | Golgi | PM | Cytosol | Nucleus | |||||
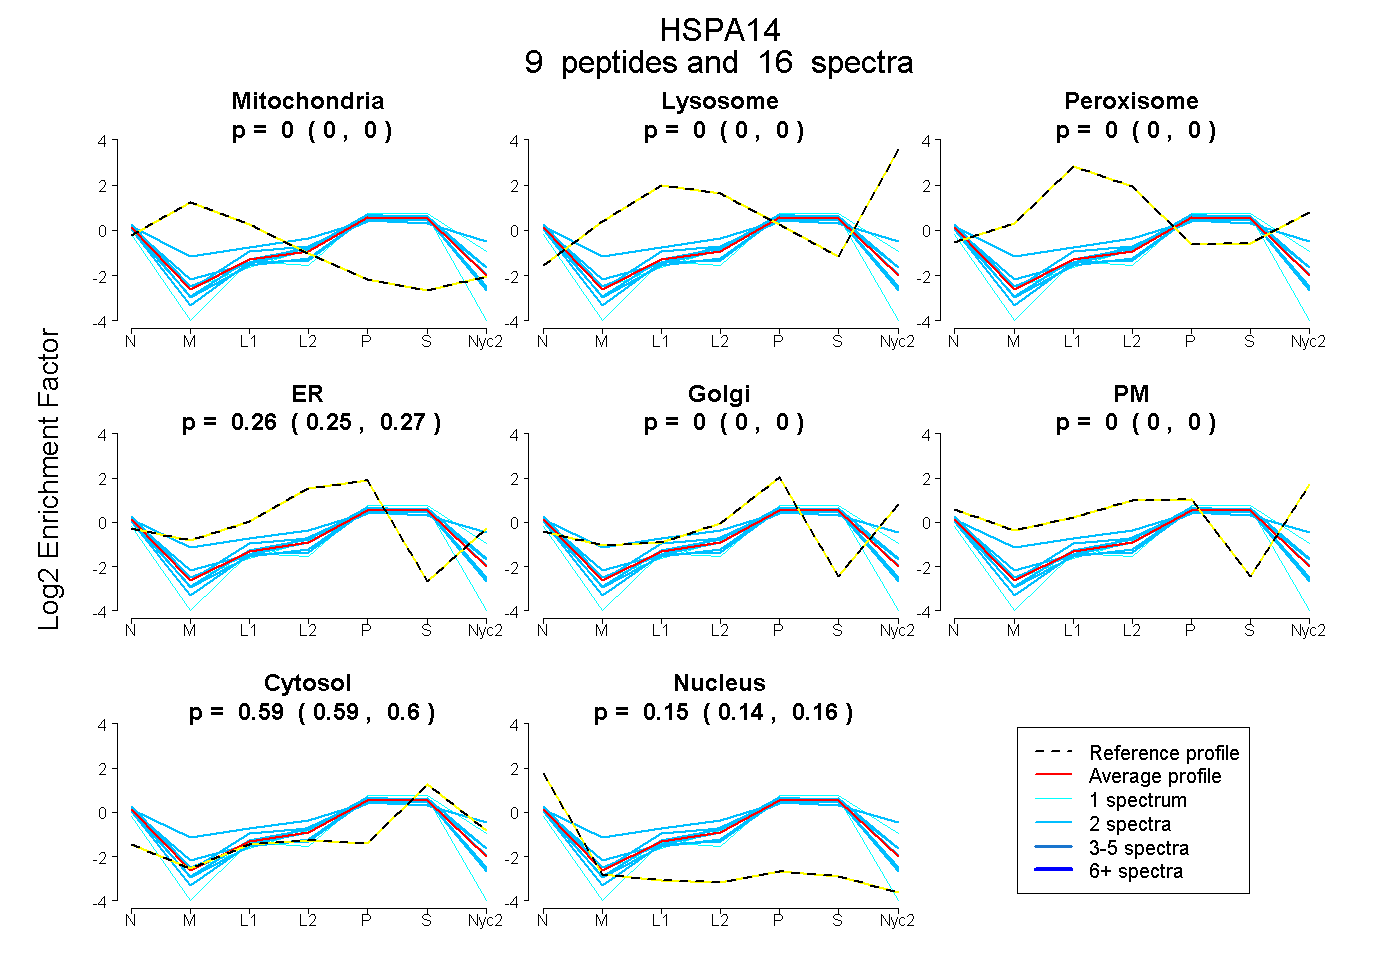
| Expt A |
9 peptides |
16 spectra |
|
0.000 0.000 | 0.000 |
0.000 0.000 | 0.000 |
0.000 0.000 | 0.000 |
0.259 0.251 | 0.266 |
0.000 0.000 | 0.000 |
0.000 0.000 | 0.000 |
0.594 0.586 | 0.601 |
0.147 0.137 | 0.156 |
| 1 spectrum, DILAVLTMK | 0.000 | 0.000 | 0.000 | 0.000 | 0.223 | 0.000 | 0.703 | 0.074 | ||
| 2 spectra, VVLCGGSSR | 0.000 | 0.000 | 0.000 | 0.255 | 0.000 | 0.000 | 0.548 | 0.197 | ||
| 1 spectrum, ESTSGDDSVLIECSAR | 0.000 | 0.000 | 0.000 | 0.192 | 0.000 | 0.000 | 0.527 | 0.281 | ||
| 2 spectra, GVDESGANR | 0.000 | 0.000 | 0.000 | 0.289 | 0.000 | 0.000 | 0.578 | 0.133 | ||
| 2 spectra, LVSPEDVAR | 0.000 | 0.000 | 0.000 | 0.170 | 0.056 | 0.000 | 0.596 | 0.179 | ||
| 2 spectra, LQYEIDTGEETK | 0.000 | 0.000 | 0.000 | 0.254 | 0.000 | 0.000 | 0.580 | 0.166 | ||
| 2 spectra, FAQVVLQDLDK | 0.000 | 0.000 | 0.000 | 0.260 | 0.000 | 0.000 | 0.569 | 0.171 | ||
| 2 spectra, IQQILK | 0.000 | 0.000 | 0.001 | 0.202 | 0.000 | 0.245 | 0.547 | 0.005 | ||
| 2 spectra, VTPAVVAYSER | 0.000 | 0.000 | 0.000 | 0.073 | 0.141 | 0.000 | 0.645 | 0.141 |
| Plot | Mito | Lyso or Perox | ER | Golgi | PM | Cytosol | Nucleus | ||||||
| Expt B |
2 peptides |
3 spectra |
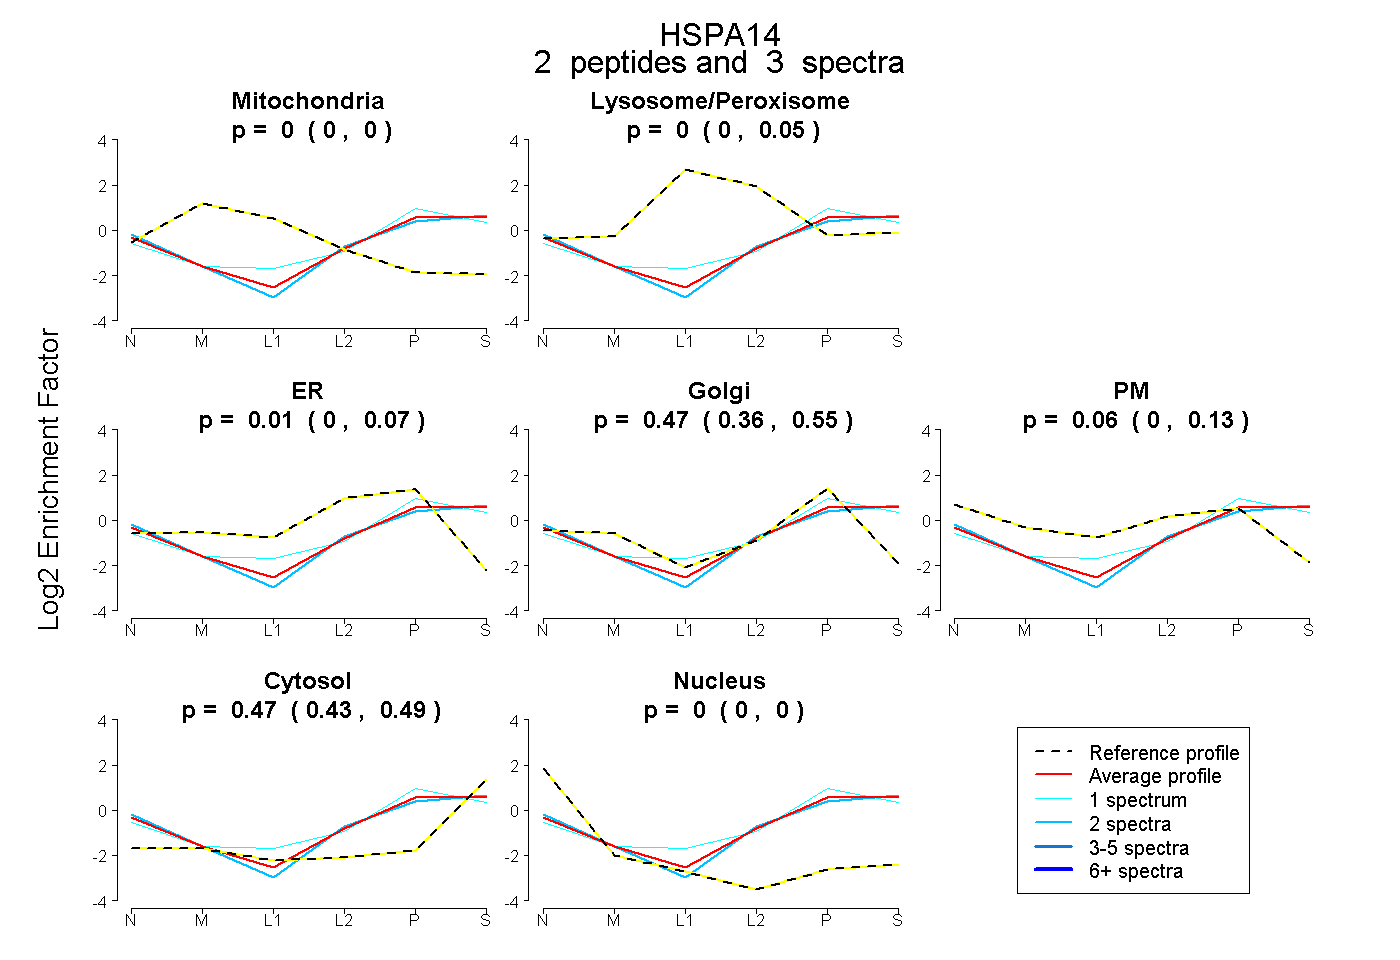 |
0.000 0.000 | 0.000 |
0.000 0.000 | 0.050 |
0.013 0.000 | 0.070 |
0.465 0.355 | 0.547 |
0.055 0.000 | 0.127 |
0.466 0.426 | 0.494 |
0.000 0.000 | 0.000 |
|||
| Plot | Lyso | Other | |||||||||||
| Expt C |
4 peptides |
7 spectra |
 |
0.000 0.000 | 0.000 |
1.000 1.000 | 1.000 |
||||||||
| Plot | Lyso | Other | |||||||||||
| Expt D |
4 peptides |
9 spectra |
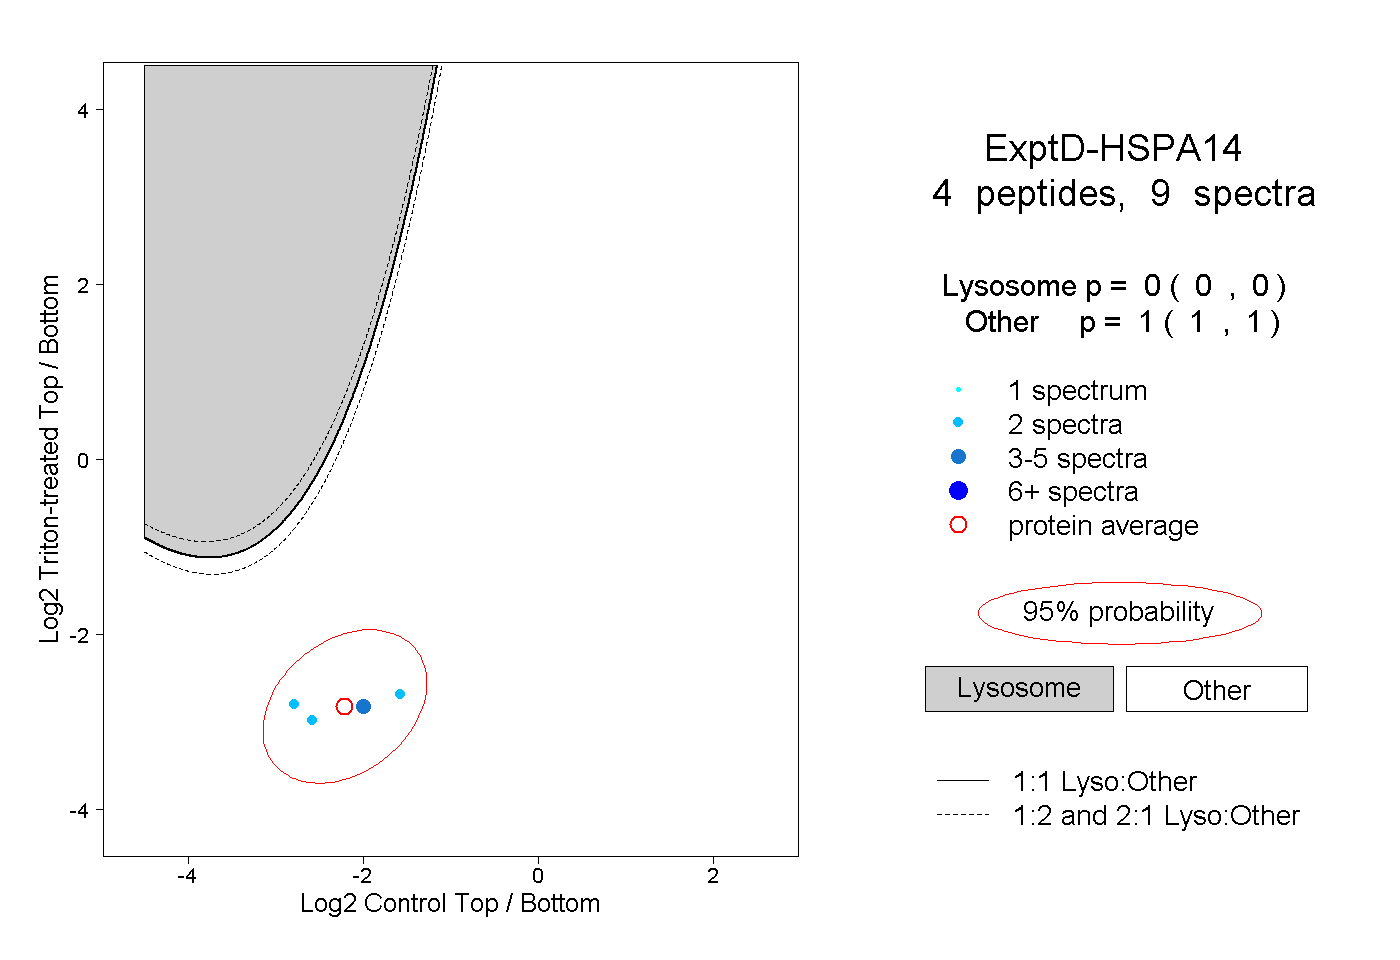 |
0.000 0.000 | 0.000 |
1.000 1.000 | 1.000 |